. 2014 Jul 3;158(1):54-68.
doi: 10.1016/j.cell.2014.06.007.

Glucose regulates mitochondrial motility via Milton modification by O-GlcNAc transferase

Affiliations

Glucose regulates mitochondrial motility via Milton modification by O-GlcNAc transferase

Gulcin Pekkurnaz et al. Cell. .

Abstract

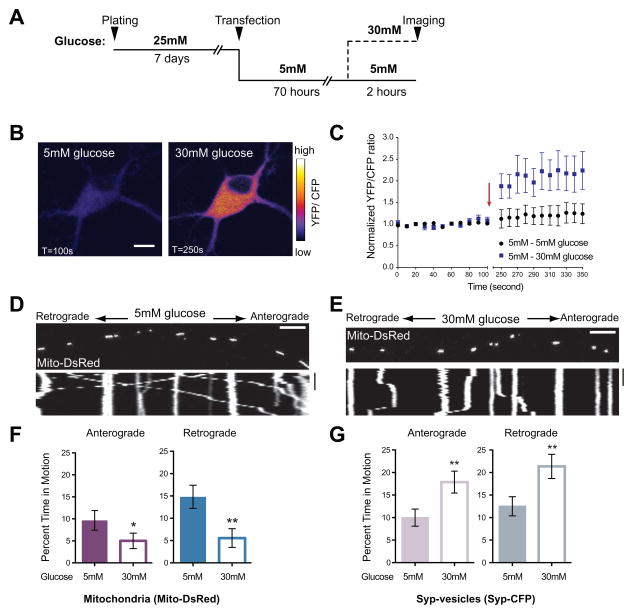
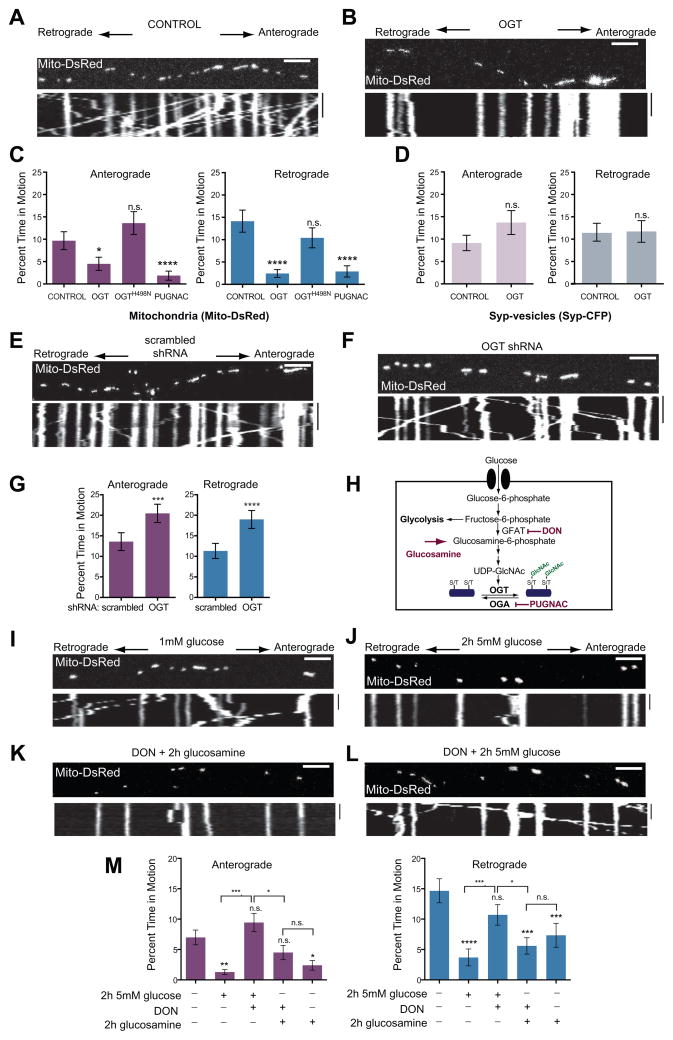
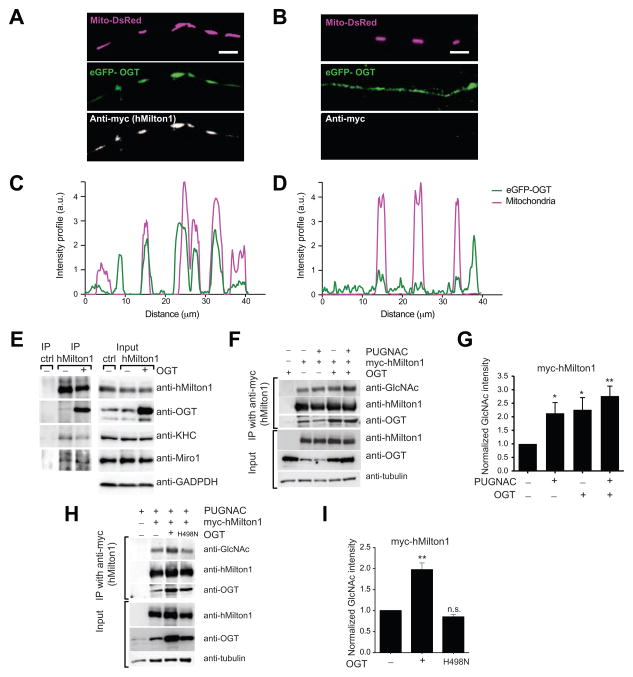
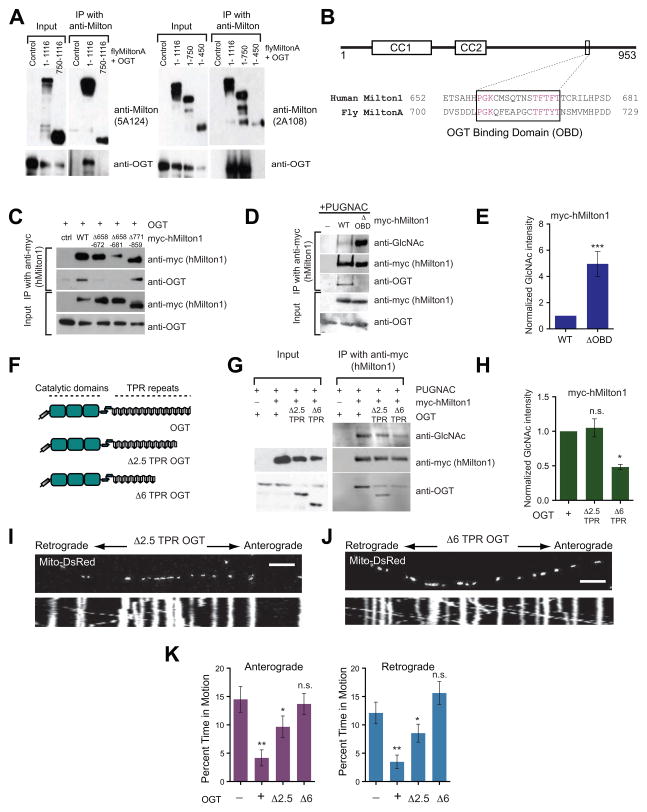
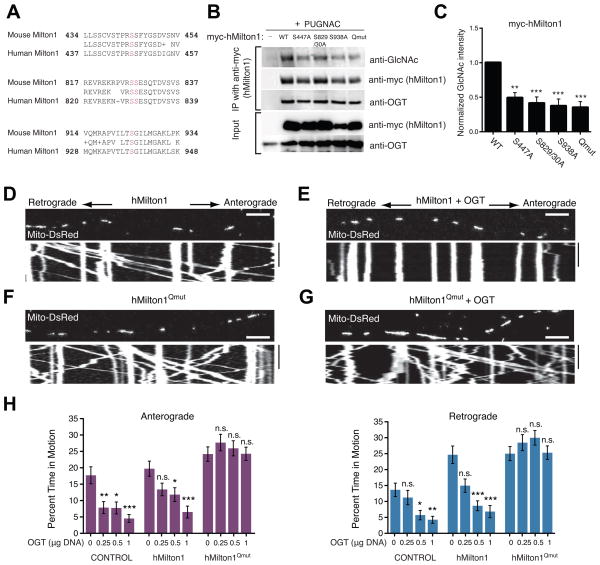
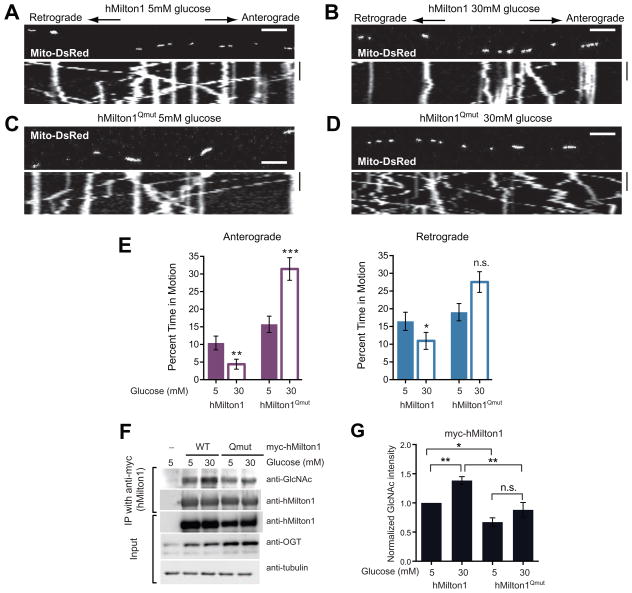
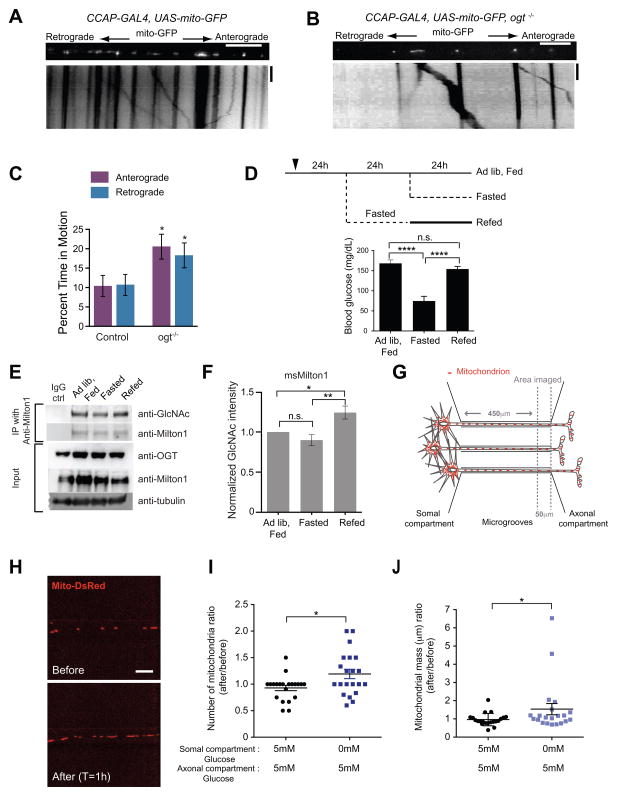
Cells allocate substantial resources toward monitoring levels of nutrients that can be used for ATP generation by mitochondria. Among the many specialized cell types, neurons are particularly dependent on mitochondria due to their complex morphology and regional energy needs. Here, we report a molecular mechanism by which nutrient availability in the form of extracellular glucose and the enzyme O-GlcNAc Transferase (OGT), whose activity depends on glucose availability, regulates mitochondrial motility in neurons. Activation of OGT diminishes mitochondrial motility. We establish the mitochondrial motor-adaptor protein Milton as a required substrate for OGT to arrest mitochondrial motility by mapping and mutating the key O-GlcNAcylated serine residues. We find that the GlcNAcylation state of Milton is altered by extracellular glucose and that OGT alters mitochondrial motility in vivo. Our findings suggest that, by dynamically regulating Milton GlcNAcylation, OGT tailors mitochondrial dynamics in neurons based on nutrient availability.


Figures

Figure 1
Figure 1. Increased Glucose Decreases Mitochondrial Motility In Rat Hippocampal Axons
(A) Schematic of the paradigm for changing extracellular glucose. (B–C) The sensor FLII12Pglu-600μδ6 was expressed in cultured rat hippocampal neurons and the YFP/CFP ratio used to determine intracellular glucose concentration in 5mM and after switching 30mM glucose medium. (B) Pseudocolored pixel by pixel ratio of a neuron before and after the switch to 30mM glucose (scale bar =10μm). (C) Normalized YFP/CFP ratios from neurons cultured in 5mM glucose before and after exchange (arrow) of medium for either fresh 5mM glucose (●) or 30mM glucose. (■). 30mM extracellular glucose caused ~2 fold increase in intracellular glucose (p=0.0007, n>4, 3 independent transfections). (D–E) Representative kymographs of mitochondrial motility in hippocampal axons transfected with Mito-DsRed and Synaptophysin (Syp)-CFP and imaged after culturing as schematized in (A). Here and in subsequent figures, the first frame of each time-lapse movie is shown above a kymograph generated from that region of axon. The y-axis of each kymograph represents time and the x-axis depicts the position of the organelles such that stationary organelles appear as vertical lines while those moving either anterograde or retrograde are diagonal. Scale bars = 10μm and 100s. (F–G) The percent time each mitochondrion (F) or Syp-vesicle (G) spent in anterograde and retrograde motion was calculated from kymographs like those in (D–E). n=73–101 mitochondria from 8 axons and n=114–126 vesicles from 7 axons and 4 independent transfections per condition. *p< 0.05, **p<0.01, Mann-Whitney U test. All values are shown as mean ± SEM. See also Movies S1–S4 and Table S1.
Figure 2
Figure 2. OGT and the Hexosamine Pathway Inhibit Mitochondrial Motility
(A–D) Kymographs of axons from hippocampal neurons transfected with Mito-DsRed and Syp-CFP, and either with (A) or without (B) OGT, and imaged 3 days after the transfection. (C, D) The percent of time mitochondria (C) and Syp-vesicles (D) spent in motion was quantified from kymographs of either control cultures, or neurons transfected with either OGT or the catalytically inactive OGTH498N or neurons pretreated for 6hrs with 100μM PUGNAC. n=100–129 mitochondria from 8 axons and n=118–165 vesicles from 7–8 axons and 4 independent transfections per condition. (E–G) Hippocampal neurons were transfected with Mito-DsRed and either a scrambled shRNA (E) or OGT shRNA (F), imaged 4 days after the transfection, and their consequences for mitochondrial motility were quantified (G). n=175–179 mitochondria from 9 axons and 3 independent transfections per condition. (H) Schematic representation of glucose and glucosamine metabolism by the Hexosamine Biosynthetic Pathway. Rate limiting steps and the inhibitors used in this study are also indicated. (I–M) Hippocampal neurons, cultured in 5mM glucose were transfected with Mito-DsRed and transferred to media containing 1mM glucose for 48h (similar to Figure 1A). Mitochondrial motility was imaged with the indicated glucose, glucosamine and DON treatments. (I, J) Representative kymograph at 1mM glucose and 2h after shift to 5mM glucose. (K, L) Addition of the GFAT inhibitor DON (100μM) prevented the reduction in motility caused by 5mM glucose (L) but not by 2h exposure to 1mM glucose and 4mM glucosamine (K). (M) Mitochondrial motility was quantified from kymographs as in (I – L). Throughout the experiments in (I–M) medium was supplemented with 1mM lactate and 1mM pyruvate, n=116–199 mitochondria from 8–13 axons and 3–4 independent transfections per condition. n.s. not significant. *p< 0.05, **p<0.01, ***p<0.001, ****p<0.0001; Kruskal-Wallis test. All values are shown as mean ± SEM. Scale bars = 10μm and 100s. See also Figure S2, Movies S5–S6 and Table S1B.
Figure 3
Figure 3. OGT and OGA regulate hMilton1 O-GlcNAcylation
(A–D) Milton expression recruits OGT to axonal mitochondria. Hippocampal axons were co-transfected with eGFP–OGT, Mito-DsRed, and either an empty vector (A, C) or myc-hMilton1 (B, D) and immunofluorescent intensity for eGFP-OGT and Mito-DsRed was measured along the length of the axons shown. (E) Immunoprecipitation (IP) of endogenous hMilton1 from HEK293T cells to analyze the consequences of OGT overexpression. Precipitation with rabbit IgG was used as a control. Input lanes were loaded with 3% of the cell lysates used for the IP and also probed with anti-GAPDH antibody as a loading control. OGT overexpression increased its coprecipitation with Milton without decreasing the presence of Miro or KHC in the complex. A lower OGT-immunoreactive band in the input lanes arises from the intramitochondrial isoform of OGT, which is not co-precipated with hMilton1. (F–I) Regulation of hMilton1 O-GlcNAcylation in HEK293T cells. Cells were transfected and treated as indicated. (F) myc-hMilton1 was immunoprecipitated with anti-myc from cells treated overnight with 100μM PUGNAC and/or overexpressing OGT. With fluorescently tagged secondary antibodies, band intensities were quantified (G) in the linear range and the intensity of each GlcNAc band was normalized to the intensity of myc bands. GlcNAc levels on myc-hMilton1 in untreated cells was set as 1 and fold changes in response to PUGNAC treatment and OGT overexpression were calculated. n=4 independent transfections per condition. (H, I) myc-hMilton1 was immunoprecipitated from HEK293T cells with or without overexpression of OGT or catalytically dead OGTH498N and its GlcNAcylation quantified as in (G). n=3 independent transfections per condition. n.s. not significant. *p< 0.05, **p<0.01, One-way ANOVA. All values are shown as mean ± SEM. Scale bar represents 10μm. See also Figure S3.
Figure 4
Figure 4. An OGT/Milton Complex Is Not Required for hMilton1 O-GlcNAcylation
(A) Coimmunoprecipitation of full length or truncated fly MiltonA and OGT proteins from HEK293T cells. Anti-Drosophila Milton antibodies 5A124 (raised against amino acids 908–1055) or 2A108 (raised against amino acids 273–450) were used to immunoprecipitate full length (1–1116) or truncated 750–1116, 1–750, and 1–450 Drosophila MiltonA. Immunoblots were probed with anti-OGT and the appropriate anti-Milton antibodies to identify Milton fragments that could associate with OGT. (B) Schematic representation of hMilton1 protein and sequence alignment of fly MiltonA (450–750) and hMilton1 (634–953) (see also Figure S4), which were determined to be important for OGT/Milton complex formation. The conserved OGT Binding Domain (OBD) is boxed; conserved amino acids are magenta. Predicted coiled coil domains of hMilton1 (CC1,2) are also illustrated. (C) Myc-hMilton1 constructs lacking the indicated amino acids were tested for their ability to precipitate coexpressed OGT from HEK293T cells. (D–E) Full length and Δ658–672 (ΔOBD) hMilton1 were immunoprecipitated from 100μM PUGNAC-treated HEK293T cells and O-GlcNAcylation was quantified as in Figure 3. Loss of the high-affinity interaction increased Milton O-GlcNAcylation. n≥3 independent transfections per condition. (F-H) Full length and truncated OGT constructs lacking either the first 2.5 or 6 TRP motifs (Δ2.5, Δ6 as shown in F) were coexpressed in HEK293T cells with full length hMilton1 (WT) to evaluate the significance of the TPR motifs on OGT/Milton complex formation and the level of hMilton1 O-GlcNAcylation. myc-hMilton1 was immunoprecipitated and immunoblots were analyzed with anti-GlcNAc, anti-myc and anti-OGT. n=3 independent transfections per condition. (I–K) Hippocampal neurons were transfected with Mito-DsRed and either full length or Δ2.5 or Δ6 truncated OGT and imaged 3 days after transfection. From kymographs as in (I and J), mitochondrial motility was quantified (K) and compared with control. n=111–209 mitochondria from 10–12 axons and 3 independent transfections per condition. n.s. not significant. *p< 0.05, **p<0.01; One-way ANOVA, Kruskal-Wallis test. All values are shown as mean ± SEM. Scale bar represents 10μm and 100s. See also Figure S3 and Table S1C.
Figure 5
Figure 5. OGT-Dependent Mitochondrial Motility Arrest Requires Milton O-GlcNAcylation
(A) Sequence alignment of O-GlcNAcylation sites (magenta) in mouse Milton1 with homologous regions in hMilton1 (see also Figure S5 and Table S1D). (B–C) Myc-hMilton1 with either individual putative GlcNAc sites mutated, or the quadruple mutant lacking all four sites (Qmut) or wildtype (WT) were expressed in HEK293T cells and cultured overnight with 100μM PUGNAC. Milton immunoprecipitates were probed with anti-GlcNAc, anti-myc and anti-OGT antibodies and GlcNAcylation levels on Milton were quantified with fluorescently tagged secondary antibodies. The intensity of each GlcNAc band was normalized to the intensity of the myc band, with the baseline hMilton1 GlcNAc level set as 1 to reveal relative changes. n≥3 independent transfections per condition. (D–G) Hippocampal neurons were transfected with Mito-DsRed and the indicated forms of hMilton1, with (E and G) or without (D and F) OGT (0.5 μg OGT DNA/well). Mitochondrial motility was imaged 3 days after transfection. (H) To assess the effect of the mutated GlcNAcylation sites, a dose/response relationship was established with different levels of DNA for OGT transfection and its effect on mitochondrial motility quantified from kymographs as in (D–G). The amount of OGT DNA transfected per well of a 24-well plate is indicated. n=75–174 mitochondria from 8–9 axons and 3 independent transfections per condition. All values are shown as mean ± SEM. The significance of changes in motility was determined relative to the motility in neurons expressing the same Milton construct without OGT transfection. n.s. not significant. *p< 0.05, **p<0.01, ***p<0.001; One-way ANOVA, Kruskal-Wallis test. Scale bar represents 10μm and 100s. See also Figure S5, Movies S7–S8 and Table S1E.
Figure 6
Figure 6. Milton O-GlcNAcylation Is Necessary for Glucose to Decrease Mitochondrial Movement
(A–D) Hippocampal neurons were transfected with Mito-DsRed, and either WT or Qmut hMilton1 constructs as indicated and cultured as per the protocol described in Figure 1A. (E) Percent time each mitochondrion spent in anterograde and retrograde motion was calculated from kymographs as in (A – D). n=105–135 mitochondria from 9 axons and 3 independent transfections per condition. Scale bar represents 10μm and 100s. See also Table S1F. (F–G) WT or Qmut myc-hMilton1 were expressed in HEK293T cells cultured in 25mM glucose containing DMEM. Glucose levels were then lowered to 5mM for 24hrs before challenging them with 30mM or 5mM glucose for 2hrs, as in the motility experiments. Milton immunoprecipitates were probed with anti-GlcNAc, anti-myc and anti-OGT antibodies (F) and GlcNAcylation levels on Milton were quantified (G). n=4 independent transfections per condition. All values are shown as mean ± SEM. n.s. not significant. *p< 0.05, **p<0.01, ***p<0.001; Mann-Whitney U test, One-way ANOVA.
Figure 7
Figure 7. Evidence of OGT-Dependent Regulation of Milton O-GlcNAcylation in vivo
(A–B) In control and ogt−/− larvae UAS-mito-GFP was expressed in an identified peptidergic axon within the segmental nerve by CCAP-GAL4. (C) The percent time each mitochondrion spent in anterograde and retrograde motion was calculated from kymographs as in (A and B). n=91–100 mitochondria from 9 axons from 9 animals. Scale bar represents 10μm and 100s. (D) Schematic of the experimental regimen for changing blood glucose levels by fasting and re-feeding and measured blood glucose levels from the mice that were used to compare Milton O-GlcNAcylation levels in the brain. (E–F) Immediately after blood glucose measurements, two cortical hemispheres were removed and homogenized. Milton1 was immunoprecipitated (E) and GlcNAcylation levels on Milton were quantified (F). n=6 pairs of animals. (G) Schematic of the microfluidic-based culture platform. The culture chamber consists of fluidically isolated somal and axonal compartments connected by microgrooves. Glucose levels in the axonal and somal compartments were independently manipulated and mitochodria were imaged in a 50μm length of axon at the proximal end of the axonal compartment. (H–J) Hippocampal neurons, cultured in microfludic devices in 5mM glucose (with 1mM lactate and pyruvate), were transfected with Mito-DsRed. The medium in the somal compartment was replaced with either the same solution or with a glucose-free medium (with 1mM lactate and pyruvate). The same axons were imaged both before and 1h after this solution change (H) so that its effect on mitochondrial density and mass could be quantified (I–J). n= 21 axons, 4 microfluidic devices per condition, 3 independent experiments. All values are shown as mean ± SEM. n.s. not significant. *p< 0.05, ****p<0.0001, Mann-Whitney U test, One-way ANOVA, Kruskal-Wallis test. See also Figure S6.

References

    1. Akimoto Y, Comer FI, Cole RN, Kudo A, Kawakami H, Hirano H, Hart GW. Localization of the O-GlcNAc transferase and O-GlcNAc-modified proteins in rat cerebellar cortex. Brain Res. 2003;966:194–205. - PubMed
    1. Brickley K, Pozo K, Stephenson FA. N-acetylglucosamine transferase is an integral component of a kinesin-directed mitochondrial trafficking complex. Biochim Biophys Acta. 2010;1813:269–281. - PubMed
    1. Butkinaree C, Park K, Hart GW. O-linked beta-N-acetylglucosamine (O-GlcNAc): Extensive crosstalk with phosphorylation to regulate signaling and transcription in response to nutrients and stress. Biochim Biophys Acta. 2010;1800:96–106. - PMC - PubMed
    1. Caldwell SA, Jackson SR, Shahriari KS, Lynch TP, Sethi G, Walker S, Vosseller K, Reginato MJ. Nutrient sensor O-GlcNAc transferase regulates breast cancer tumorigenesis through targeting of the oncogenic transcription factor FoxM1. Oncogene. 2010;29:2831–2842. - PubMed
    1. Capotosti F, Guernier S, Lammers F, Waridel P, Cai Y, Jin J, Conaway JW, Conaway RC, Herr W. O-GlcNAc transferase catalyzes site-specific proteolysis of HCF-1. Cell. 2011;144:376–388. - PubMed

Publication types