. 2014 Jul 3;158(1):69-83.
doi: 10.1016/j.cell.2014.04.049.

IRF4 is a key thermogenic transcriptional partner of PGC-1α

Affiliations

IRF4 is a key thermogenic transcriptional partner of PGC-1α

Xingxing Kong et al. Cell. .

Abstract

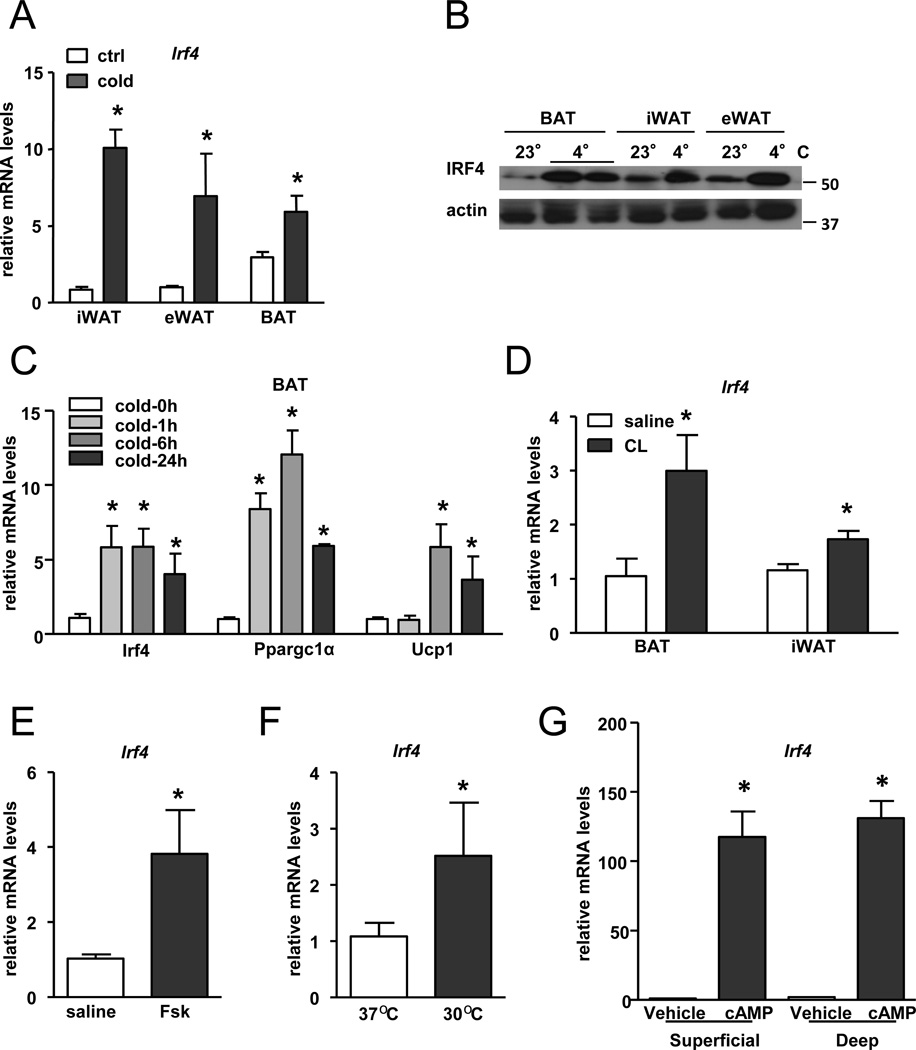
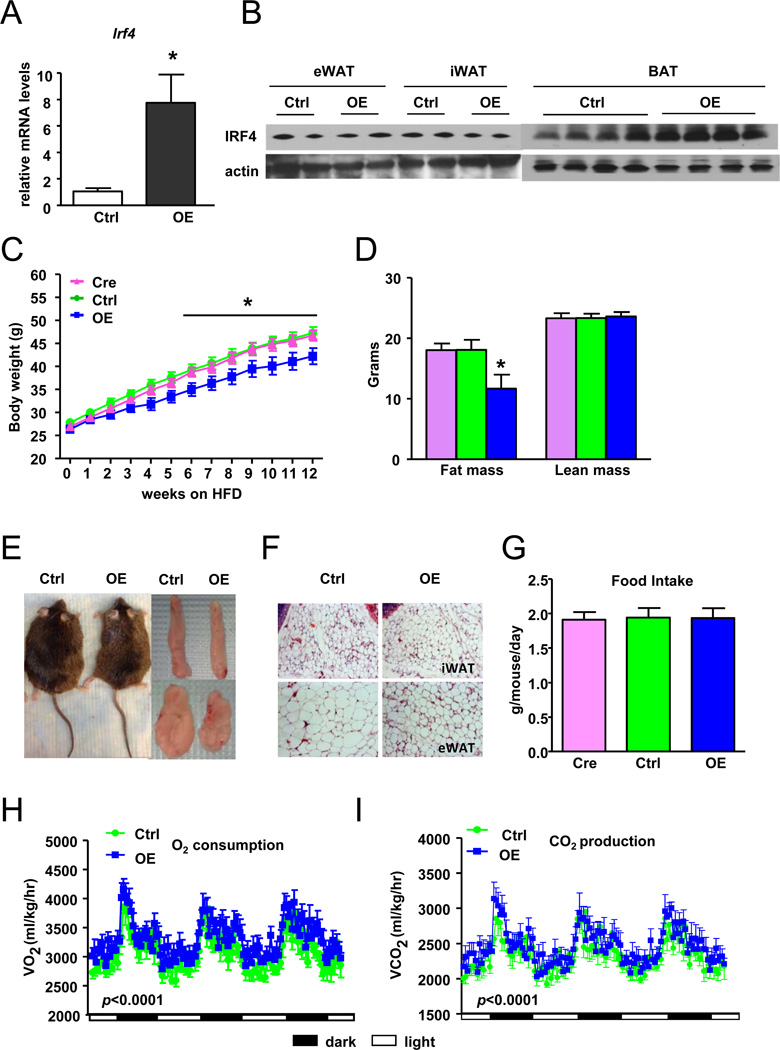
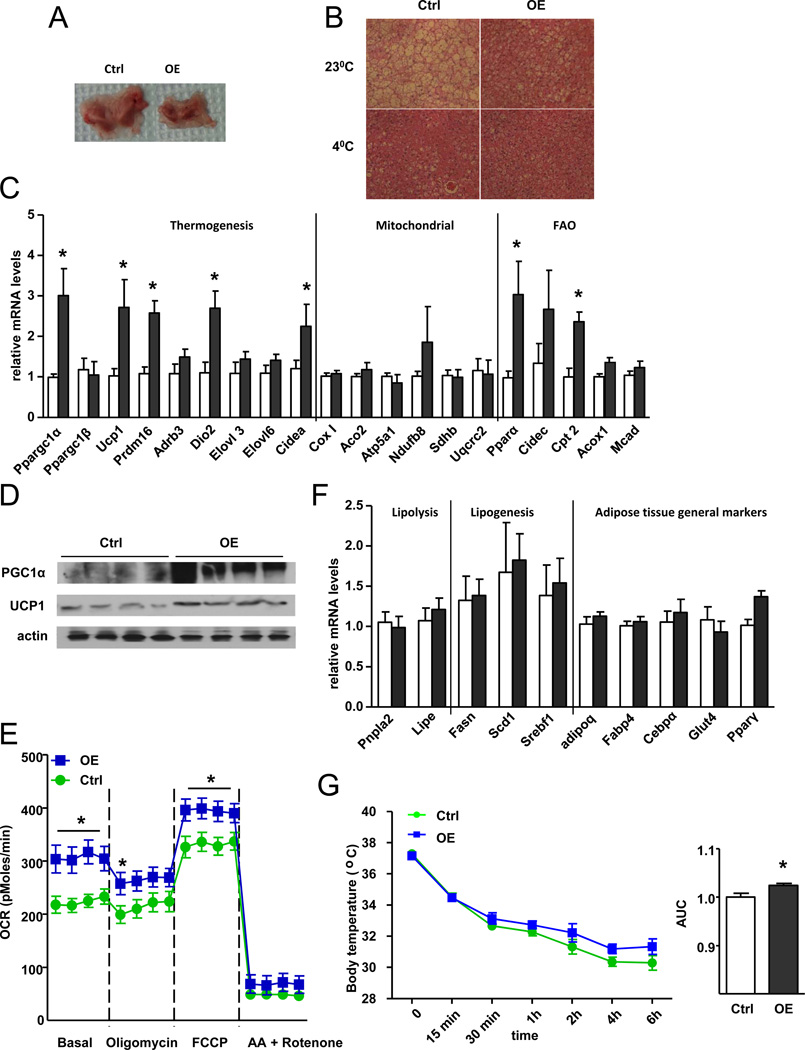
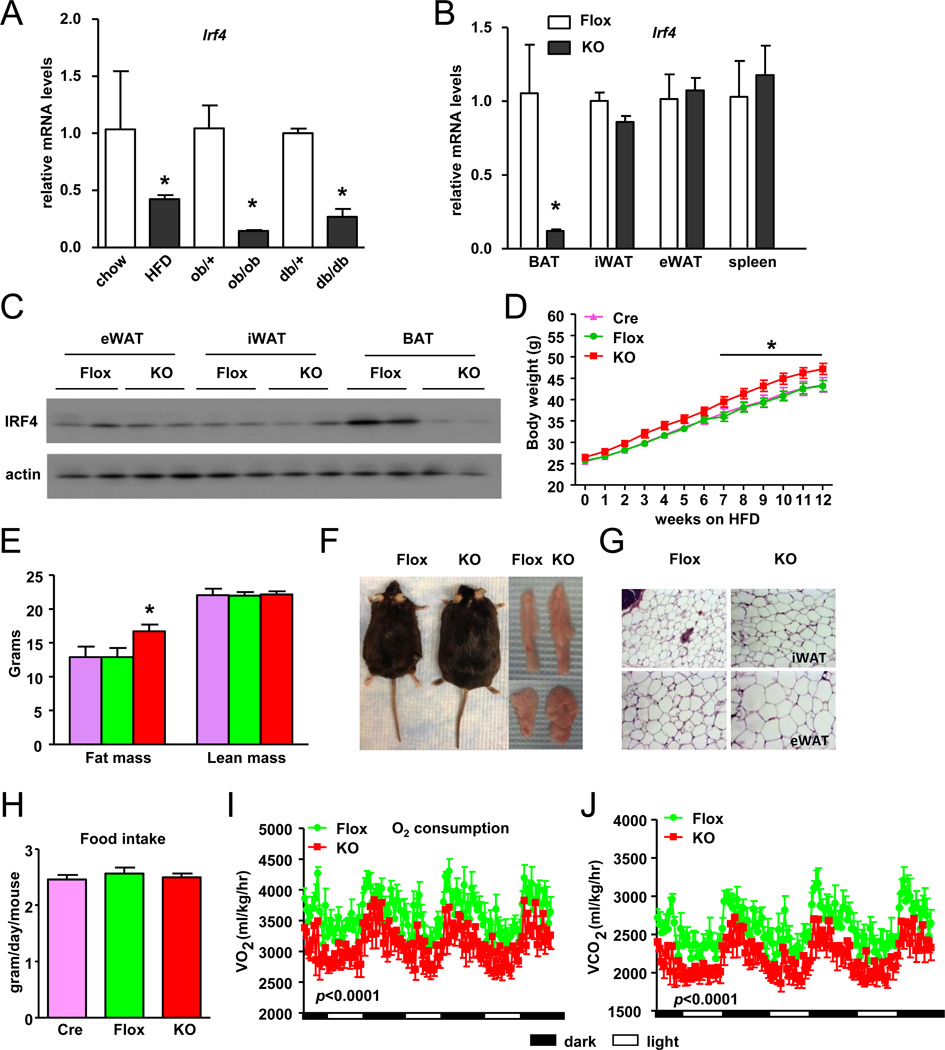
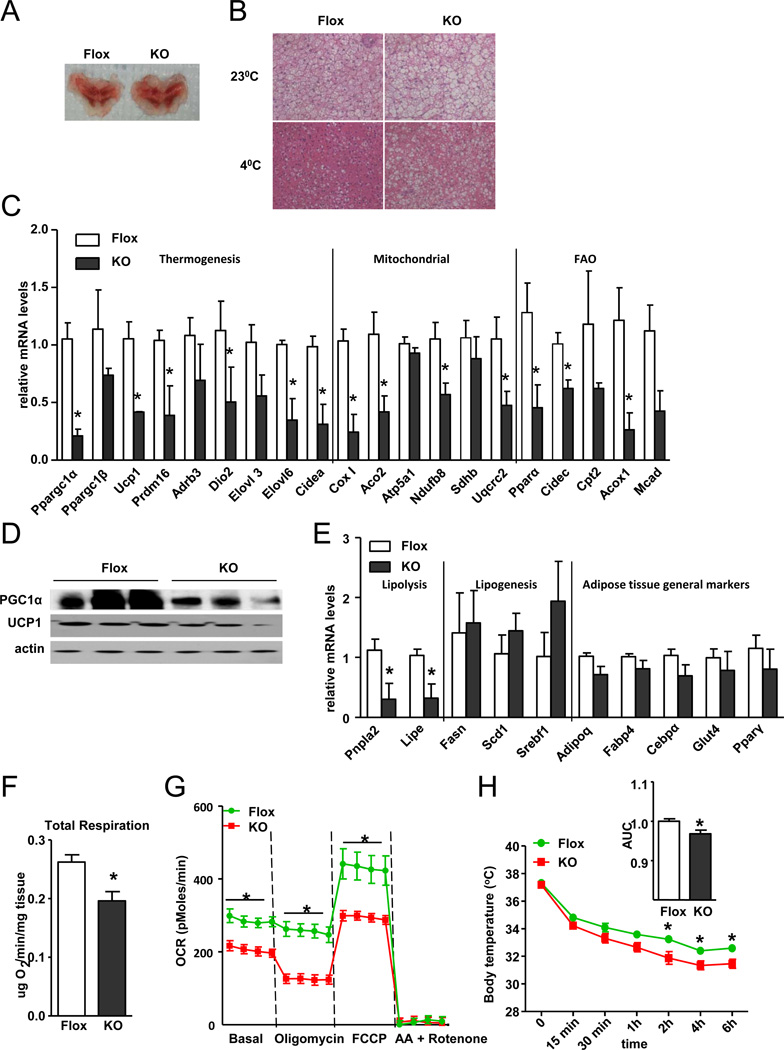
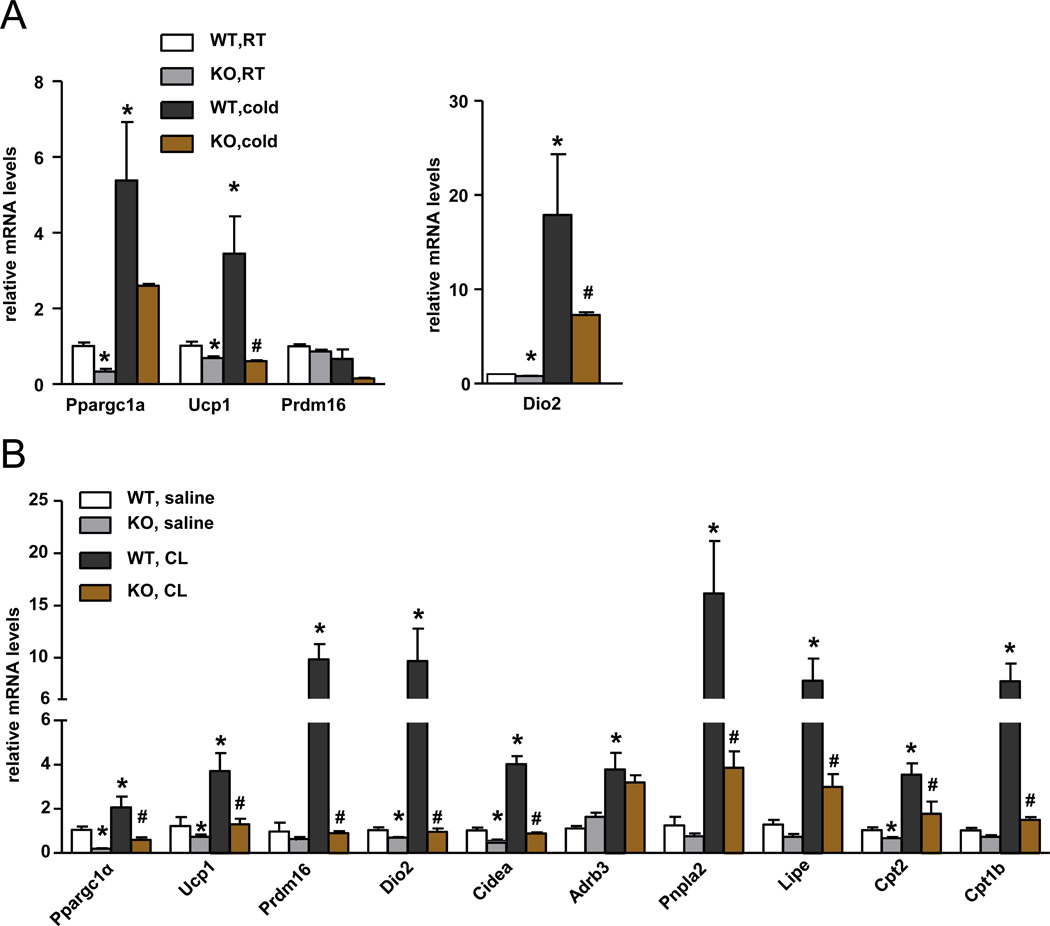
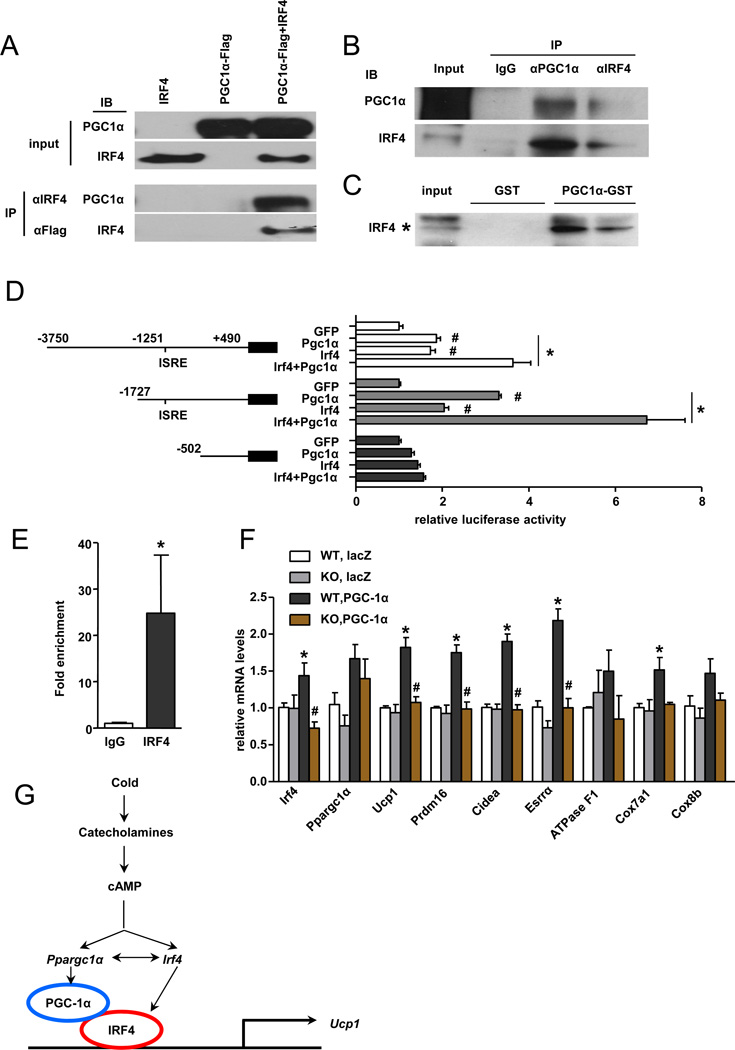
Brown fat can reduce obesity through the dissipation of calories as heat. Control of thermogenic gene expression occurs via the induction of various coactivators, most notably PGC-1α. In contrast, the transcription factor partner(s) of these cofactors are poorly described. Here, we identify interferon regulatory factor 4 (IRF4) as a dominant transcriptional effector of thermogenesis. IRF4 is induced by cold and cAMP in adipocytes and is sufficient to promote increased thermogenic gene expression, energy expenditure, and cold tolerance. Conversely, knockout of IRF4 in UCP1(+) cells causes reduced thermogenic gene expression and energy expenditure, obesity, and cold intolerance. IRF4 also induces the expression of PGC-1α and PRDM16 and interacts with PGC-1α, driving Ucp1 expression. Finally, cold, β-agonists, or forced expression of PGC-1α are unable to cause thermogenic gene expression in the absence of IRF4. These studies establish IRF4 as a transcriptional driver of a program of thermogenic gene expression and energy expenditure.


Figures

Figure 1
Figure 1. Irf4 expression is induced by cold exposure and β3-AR agonist in adipocytes
A, B, QPCR and Western blotting were performed on mRNA and protein from fat depots of C57BL/6 mice at RT or exposed to 4°C for 6 hours. C, QPCR was performed on mRNA from BAT of C57BL/6 mice exposed to 4°C for the indicated lengths of time. N=5. D, Mice were treated with CL316,243 for 6h prior to tissue harvest and QPCR. E, SVF from inguinal fat was differentiated into adipocytes ex vivo, treated with Forskolin for 4h, then analyzed by QPCR. F, 3T3-F442A adipocytes were differentiated and cultured at 37°C or 30°C for 10 days followed by harvest and QPCR. G, SVF from superficial and deep neck adipose tissue depots from four human subjects were differentiated into mature adipocytes and treated for 4h with 500 mM dibutyryl-cAMP. For all parts, *p< 0.05, expressed as mean ± SEM.
Figure 2
Figure 2. Mice that overexpress IRF4 in BAT (BATI4OE) are lean and display evidence of enhanced energy expenditure
A, B, IRF4 overexpression was verified in BATI4OE mice by QPCR and Western blotting. Data are normalized to 36B4 and expressed as mean ± SEM (n=4, *p<0.05). Control mice for all BATI4OE experiments are R26-LSL-IRF4;Cre. C, Body weight of BATI4OE mice on HFD (n=9–16/group, *p<0.05). D, Body composition of mice from C after 12 weeks of high-fat feeding (*p<0.05). E, Gross morphology of BATI4OE mice (36 weeks old) and inguinal and epididymal fat pads after high-fat feeding. F, Hematoxylin and eosin staining of paraffin-embedded inguinal and epididymal WAT sections from 36-week-old mice (X20). G, Food intake was measured daily after 3 weeks on HFD (n=8), and cumulative food intake was calculated after 3 days. H, I, O2 consumption and CO2 production rates of BATI4OE and WT littermates were measured by indirect calorimetry using CLAMS after 4 weeks on HFD (n=8; *p<0.0001 for both). See also Supplemental Figures S1 and S2.
Figure 3
Figure 3. BATI4OE mice display increased thermogenic gene expression and cold tolerance
A, Gross appearance of interscapular BAT from control and BATI4OE mice at RT. B, Hematoxylin and eosin staining of BAT sections from control and BATI4OE mice housed at 23°C or 4°C for 6hrs. C, Thermogenic, mitochondrial and fatty acid oxidation gene expression in BAT. RNA was harvested from BAT of BATI4OE and control littermates after 28 weeks on HFD at 23°C. Gene expression was measured using QPCR. Data are normalized to 36B4 and expressed as mean ± SEM (n=3–5, *p<0.05). D, Western blot analysis of protein in BAT of mice from C. E, Continuous measurement of oxygen consumption rate (OCR) in isolated mitochondria from BAT of BATI4OE and control mice on chow. Oxygen consumption was performed under basal conditions, following the addition of oligomycin (14µM), the pharmacological uncoupler FCCP (10µM) or the Complex III and I inhibitor antimycin A and rotenone (4µM each) (n=10–12, *p<0.05). F, Lipid handling and general adipose marker gene expression in BAT. RNA was harvested from BAT of BATI4OE and control littermates after 28 weeks on HFD at 23°C. Gene expression was measured using QPCR. Data are normalized to 36B4 and expressed as mean±SEM (n=3–5, *p<0.05). G, Rectal temperature of control and BATI4OE mice during acute cold exposure (4°C). Results are expressed as mean±SEM (n=6 mice per group, *p<0.05 for AUC). See also Supplemental Figure S3.
Figure 4
Figure 4. Mice lacking IRF4 in brown adipose tissue (BATI4KO) have reduced energy expenditure
A, Irf4 mRNA expression was measured by QPCR in BAT from high-fat diet (HFD), ob/ob, and db/db mice (n=3–5; *p<0.05). B, Irf4 expression in different tissues of BATI4KO and control mice (n=4; *p<0.05). C, Western blot analysis of IRF4 protein levels in various adipose depots from mice in B. D, Body weights of male Cre only, Flox only and BATI4KO (KO) mice on HFD (n=8–19). E, Body composition of the mice from C (*p<0.05). F, Gross morphology of BATI4KO mice (30 weeks old) and inguinal and epididymal fat pads. G, Hematoxylin and eosin staining of inguinal and epididymal WAT sections from 30-week-old mice (X20). H, Food intake was measured daily after 20 weeks on HFD (n=8), and cumulative food intake was calculated after 3 days. I, J, O2 consumption and CO2 production rates of BATI4KO and control littermates were measured by indirect calorimetry using CLAMS after 22 weeks on HFD (n=8; *p<0.0001 for both). See also Supplemental Figure S4.
Figure 5
Figure 5. BATI4KO mice display decreased thermogenic gene expression and cold intolerance
A, Gross appearance of interscapular BAT from control and BATI4OE mice at RT. B, Hematoxylin and eosin staining of BAT sections from mice housed at 23°C or 4°C for 6 hours. C, Thermogenic, mitochondrial and fatty acid oxidation gene expression in BAT. RNA was harvested from BAT of BATI4KO or control littermates after 22 weeks on HFD. Gene expression was measured using QPCR. Data are normalized to 36B4 and expressed as mean ± SEM (n=3–5, *p<0.05). D, Western blot analysis of protein in BAT of mice in C. E, Lipid handling and general adipose marker gene expression in BAT. RNA was harvested from BAT of BATI4KO or control littermates after 22 weeks on HFD. Gene expression was measured using QPCR. Data are normalized to 36B4 and expressed as mean ± SEM (n=3–5, *p<0.05). F, Total respiration in BAT measured by Clark electrode (n=4, *p<0.05). G, Continuous measurement of oxygen consumption rate (OCR) in isolated mitochondria from BAT of BATI4KO and control mice on chow. Oxygen consumption was performed under basal conditions, following the addition of oligomycin (14µM), the pharmacological uncoupler FCCP (10µM) or the Complex III and I inhibitor antimycin A and rotenone (4µM each) (n=7–13, *p<0.05). H, Rectal temperature of control and BATI4KO mice during cold exposure (4°C). Results are expressed as mean ± SEM, *p<0.05 relative to Flox mice (n=6 mice per group). See also Supplemental Figures S5 and S6.
Figure 6
Figure 6. Cold and β3-agonist cannot induce thermogenic expression in the absence of IRF4
A, RNA was harvested from interscapular BAT of BATI4KO or control littermates housed at 23°C or 4°C for 6hrs. Gene expression was measured using QPCR. Data are normalized to 36B4 and expressed as mean ± SEM (n=3–5, *, vs WT RT, p<0.05; #, vs WT cold, p<0.05). B, Mice were treated with CL316,423 or saline for 6hrs and BAT was harvested. Gene expression was analyzed by QPCR. Data are normalized to 36B4 and expressed as mean±SEM (n=3–5, *, vs WT saline, p<0.05; #, vs WT CL, p<0.05).
Figure 7
Figure 7. PGC-1α interacts with IRF4 and enhances its transcriptional activity
A, Co-immunoprecipitation of PGC-1α-FLAG and IRF4 expressed in 293 cells. B, Co-immunoprecipitation of endogenous PGC-1α and IRF4 in BAT of WT mice. Mice were exposed to 4°C for 6hrs and then sacrificed for BAT protein extraction; data represent pooled BAT from 5 animals. C, Direct interaction between PGC-1α and IRF4 by GST-pull down assay. D, Fragments of the Ucp1 promoter fused to a luciferase reporter gene were cotransfected into 293 cells together with pCDH-GFP (control) or IRF4 in the presence or absence of a PGC-1α expression plasmid. Luciferase activity was corrected for Renilla luciferase activity and normalized to control activity (n=3, *p<0.05). E, ChIP analysis in BAT from BATI4OE mice. The signal in IgG is set as 1. Results are expressed as mean ± SD (n=3, *p<0.05). F, Adenovirus expressing PGC-1α or lacZ was injected into the inguinal fat pad of control or BATI4KO mice (n=3–6, *p<0.05). G, Model of how PGC-1α and IRF4 interact at the genetic, physical, and functional levels to promote thermogenic gene expression. See also Supplemental Figure S7.

Similar articles

Cited by

References

    1. Alon U. Network motifs: theory and experimental approaches. Nature reviews Genetics. 2007;8:450–461. - PubMed
    1. Altarejos JY, Montminy M. CREB and the CRTC co-activators: sensors for hormonal and metabolic signals. Nature reviews Molecular cell biology. 2011;12:141–151. - PMC - PubMed
    1. Boyer BB, Kozak LP. The mitochondrial uncoupling protein gene in brown fat: correlation between DNase I hypersensitivity and expression in transgenic mice. Molecular and cellular biology. 1991;11:4147–4156. - PMC - PubMed
    1. Brustle A, Heink S, Huber M, Rosenplanter C, Stadelmann C, Yu P, Arpaia E, Mak TW, Kamradt T, Lohoff M. The development of inflammatory T(H)-17 cells requires interferon-regulatory factor 4. Nature immunology. 2007;8:958–966. - PubMed
    1. Cretney E, Xin A, Shi W, Minnich M, Masson F, Miasari M, Belz GT, Smyth GK, Busslinger M, Nutt SL, et al. The transcription factors Blimp-1 and IRF4 jointly control the differentiation and function of effector regulatory T cells. Nature immunology. 2011;12:304–311. - PubMed

Publication types

MeSH terms