. 2014 Jul 3;158(1):213-25.
doi: 10.1016/j.cell.2014.05.034.

Expansion of biological pathways based on evolutionary inference

Affiliations

Expansion of biological pathways based on evolutionary inference

Yang Li et al. Cell. .

Abstract

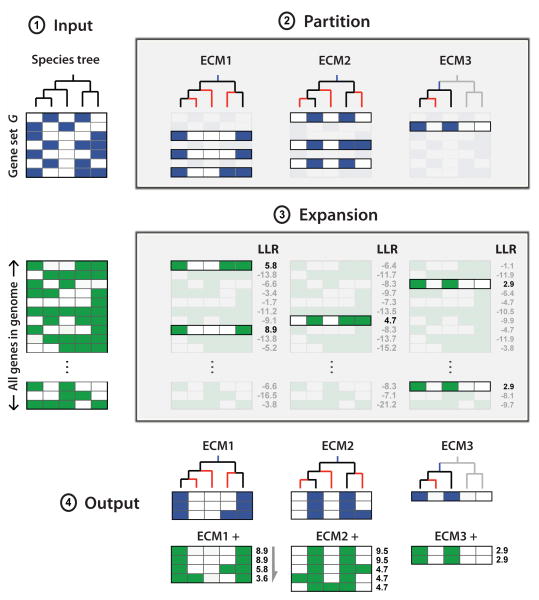
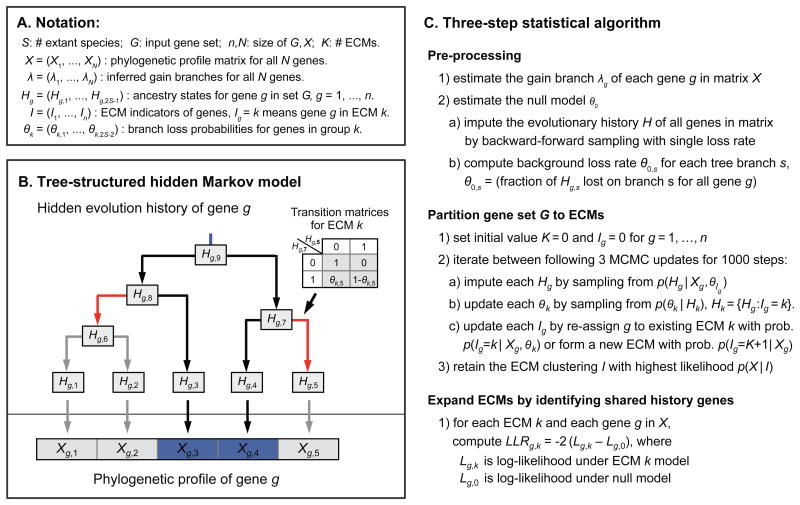
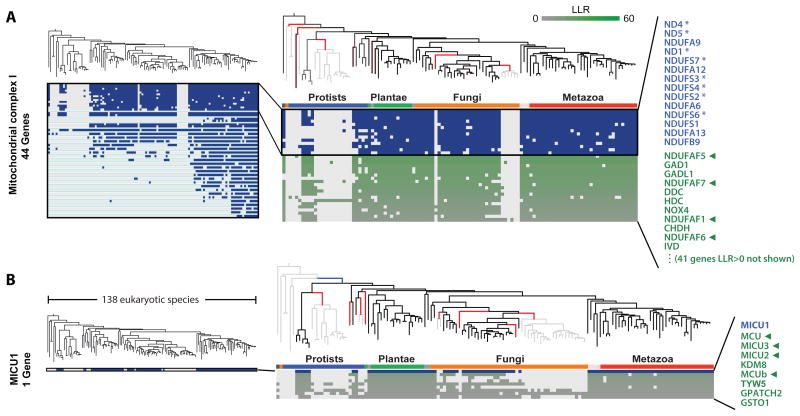
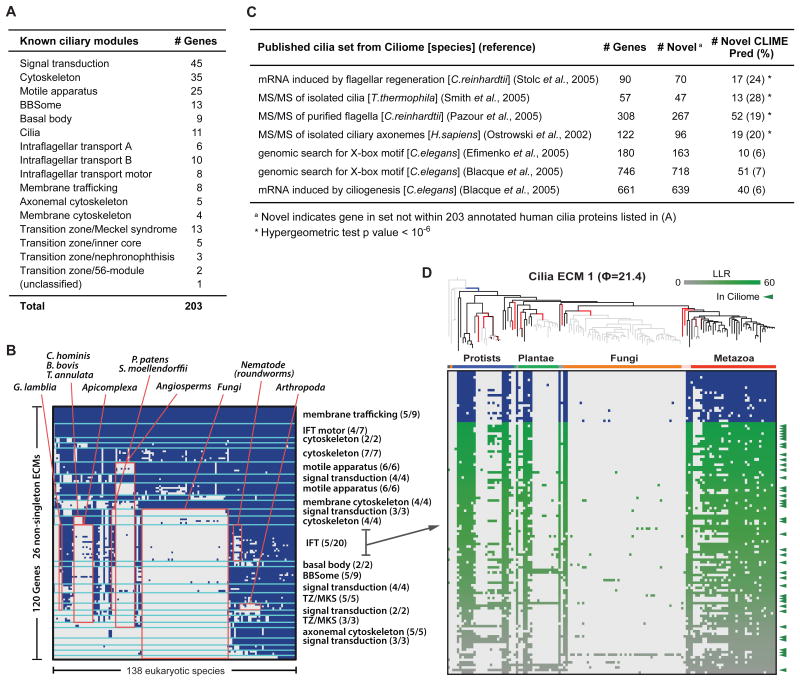
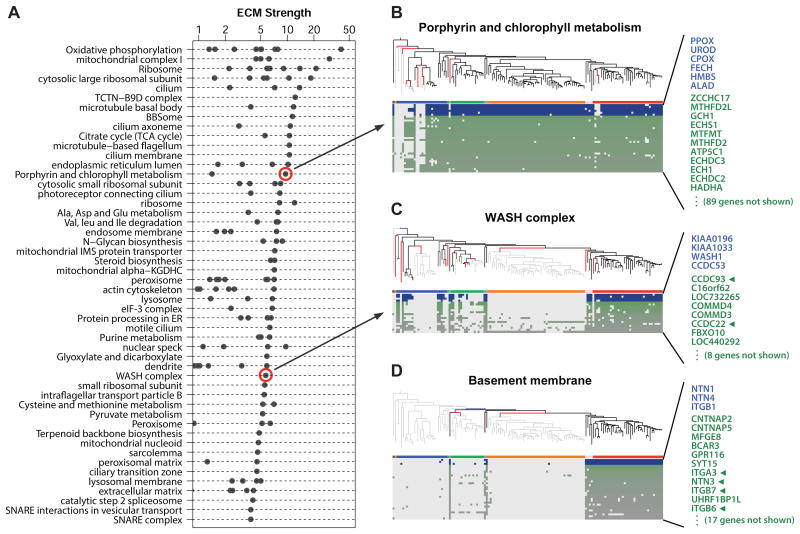
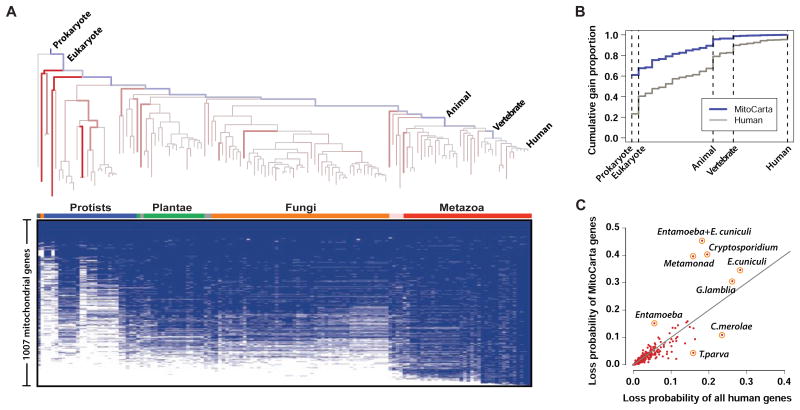
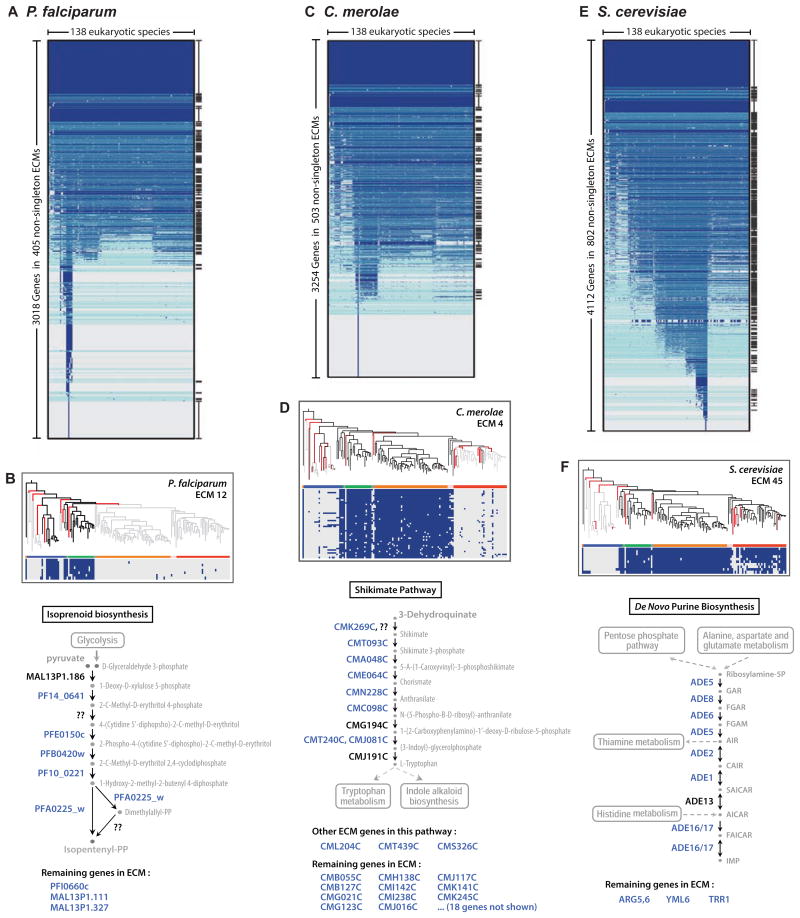
The availability of diverse genomes makes it possible to predict gene function based on shared evolutionary history. This approach can be challenging, however, for pathways whose components do not exhibit a shared history but rather consist of distinct "evolutionary modules." We introduce a computational algorithm, clustering by inferred models of evolution (CLIME), which inputs a eukaryotic species tree, homology matrix, and pathway (gene set) of interest. CLIME partitions the gene set into disjoint evolutionary modules, simultaneously learning the number of modules and a tree-based evolutionary history that defines each module. CLIME then expands each module by scanning the genome for new components that likely arose under the inferred evolutionary model. Application of CLIME to ∼1,000 annotated human pathways and to the proteomes of yeast, red algae, and malaria reveals unanticipated evolutionary modularity and coevolving components. CLIME is freely available and should become increasingly powerful with the growing wealth of eukaryotic genomes.


Figures

Figure 1
Figure 1. Schematic overview of CLIME
CLIME partitions an input set of genes into evolutionarily conserved modules (ECMs), and predicts additional genes sharing the same inferred model of evolution. Input: species tree, an input gene set (G), and a phylogenetic matrix (X) for all genes in a reference organism showing presence (green) or absence (white) across all extant species in the tree. For display purposes, a separate blue/white matrix shows the profiles of genes in G, which are a subset of X. Partition: input genes G are partitioned into K distinct ECMs, using a Bayesian mixture of HMMs to simultaneously infer the number of ECMs and the shared evolutionary history of each ECM. Each ECM is modeled by a tree structured HMM with an inferred gain branch (blue) and branch-specific probabilities of gene loss (red). Expansion: each ECM is expanded by identifying genes within the genome that are more likely to have evolved from the ECM's model of evolutionary history compared to a null model of evolution, scored by the log likelihood ratio (LLR). Output: K disjoint ECM clusters and associated ECM+ expansions.
Figure 2
Figure 2. The CLIME algorithm
(A) Notation for random variables in CLIME's statistical model. (B) CLIME's generative tree-structured HMM, including observed states (Xg) and hidden states (Hg) that correspond to the inferred presence/absence of gene g in all living and extinct species in the pre-defined tree. The model is constrained to a single gain branch (blue). Loss events are modeled using branch-specific transition matrices (inset) derived from an ECM or null model (red color indicates branches with high loss probability). This example shows the likely evolutionary scenario that phylogenetic profile of gene g (presence only in species 3 and 4) is generated from ECM k which has high loss rates on two branches (red color), so gene g is likely to be lost on these branches while inherited on other branches. (C) Statistical details for three steps of CLIME.
Figure 3
Figure 3. Application of CLIME to mitochondrial complex I and calcium uniporter
(A) CLIME partitioning of the 44 subunits of mitochondrial respiratory chain complex I into ECMs (separated by aqua lines). Inset shows ECM1, including the independent loss events (red branches), the phylogenetic profile for the ECM1 genes (blue/white matrix and blue text) and the top genes in ECM1+ (green/white matrix and green text). Tree branch color indicates gene gain (blue), loss (red, brighter hue indicating higher confidence), or inheritance (black), otherwise shown gray. Asterisks indicate core bacterial complex I homologs. Green arrows indicate predictions with recent experimental or human genetic support for functional association with the input set. (B) CLIME partitioning of the single input gene MICU1, which encodes the first identified protein component of the mitochondrial calcium uniporter complex. The ECM1+ includes four components recently shown to encode uniporter proteins (green arrows).
Figure 4
Figure 4. Application of CLIME to cilia
(A) Annotation of 203 human cilia-related genes within 16 sub-compartments. (B) CLIME partition of 203 cilia genes into modules (separated by aqua lines). Red boxes indicate shared absence in selected clades, labeled above. Sub-compartments with significant enrichment per ECM are labeled at right (parentheses show fraction of ECM genes within sub-compartment). (C) Overlap between CLIME predictions and seven orthogonal cilia gene sets (Inglis et al., 2006). (D) The ciliary ECM with highest ECM strength (21.4), including the evolutionary model (gain branch in blue, loss branches in red), the ECM genes (blue text and blue/white matrix) and the ECM+ predictions (green/white matrix). Green tick marks indicate predictions with independent evidence of cilia-related function based on Ciliome database.
Figure 5
Figure 5. CLIME analysis of 1025 human pathways
(A) Top 50 pathways with highly informative ECMs (strength > 2 and containing at least 50% non-homologous genes), ranked by strength of the top non-homologous ECM. All non-singleton ECMs are shown as separate dots. (B-D) ECMs for selected pathways. As in Figure 3, the inferred gain/loss events are indicated by blue and red tree branches. Blue/white and green/white matrices show phylogenetic profiles of ECM and ECM+ genes, respectively. Green arrows indicate experimental evidence of functional association with the input gene set.
Figure 6
Figure 6. CLIME analysis of the mitochondrial proteome
(A) CLIME's estimates of proportions of gene gain (blue branches) and average branch-specific probabilities of gene loss (red branches) on the 138 eukaryotic species tree for the 1007 human mitochondrial genes. Brighter hue indicates higher probability. The presence/absence of the 1007 human mitochondrial genes across 138 species is shown in blue/white matrix. (B) Cumulative gain proportions of mitochondrial genes versus all human genes (only selected branches labeled). (C) Average loss probability of mitochondrial genes versus all human genes for each tree branch (only selected branches labeled).
Figure 7
Figure 7. Application of CLIME to the genomes of malaria parasite, red alga, and yeast
CLIME partitioning of all genes within three model organisms: Plasmodium falciparum (A), Cyanidioschyzon merolae (C), and Saccharomyces cerevisiae (E). ECMs are ordered by mean number of homologs present across taxa, and separated by aqua lines. All ECMs significantly enriched (hypergeometric p-value<10-6) in GO or KEGG gene sets are marked at right. Selected ECMs are shown for the three species (B, D, F), along with schematic pathway diagrams that highlight the location of ECM genes (blue text), genes not in the ECM (black text), and enzymes not known to reside in the species (question marks) based on KEGG. Genes within the ECM but not present in the relevant KEGG pathway are listed below, and may encode novel pathway members.

Comment in

References

    1. Ashburner M, Ball CA, Blake JA, Botstein D, Butler H, Cherry JM, Davis AP, Dolinski K, Dwight SS, Eppig JT, et al. Gene ontology: tool for the unification of biology. The Gene Ontology Consortium. Nat Genet. 2000;25:25–29. - PMC - PubMed
    1. Balsa E, Marco R, Perales-Clemente E, Szklarczyk R, Calvo E, Landázuri MO, Enríquez JA. NDUFA4 is a subunit of complex IV of the mammalian electron transport chain. Cell Metabolism. 2012;16:378–386. - PubMed
    1. Barker D, Meade A, Pagel M. Constrained models of evolution lead to improved prediction of functional linkage from correlated gain and loss of genes. Bioinformatics. 2007;23:14–20. - PubMed
    1. Barker D, Pagel M. Predicting Functional Gene Links from Phylogenetic-Statistical Analyses of Whole Genomes. PLoS Computational Biology. 2005;1:e3. - PMC - PubMed
    1. Baughman JM, Perocchi F, Girgis HS, Plovanich M, Belcher-Timme CA, Sancak Y, Bao XR, Strittmatter L, Goldberger O, Bogorad RL. Integrative genomics identifies MCU as an essential component of the mitochondrial calcium uniporter. Nature. 2011;476:341–345. - PMC - PubMed

Publication types

LinkOut - more resources