

Extensive structural variations between mitochondrial genomes of CMS and normal peppers (Capsicum annuum L.) revealed by complete nucleotide sequencing
- PMID: 24996600
- PMCID: PMC4108787
- DOI: 10.1186/1471-2164-15-561
Extensive structural variations between mitochondrial genomes of CMS and normal peppers (Capsicum annuum L.) revealed by complete nucleotide sequencing
Abstract
Background: Cytoplasmic male sterility (CMS) is an inability to produce functional pollen that is caused by mutation of the mitochondrial genome. Comparative analyses of mitochondrial genomes of lines with and without CMS in several species have revealed structural differences between genomes, including extensive rearrangements caused by recombination. However, the mitochondrial genome structure and the DNA rearrangements that may be related to CMS have not been characterized in Capsicum spp.
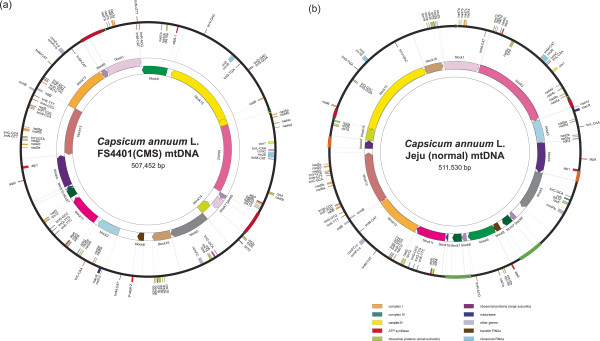
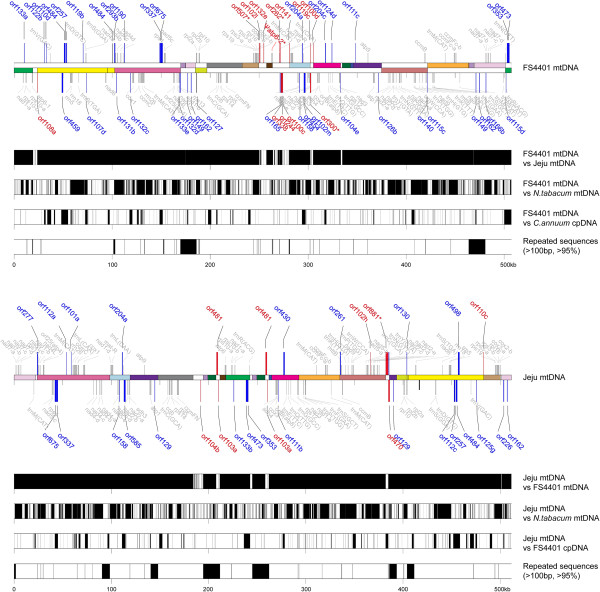
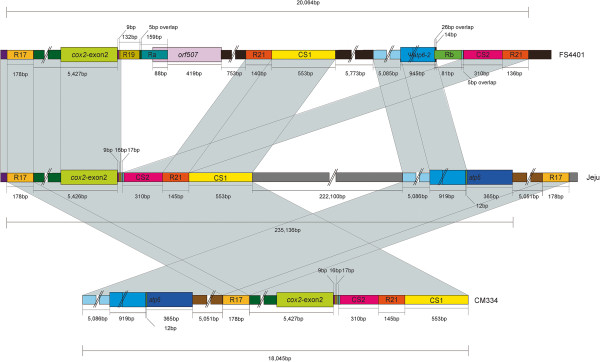
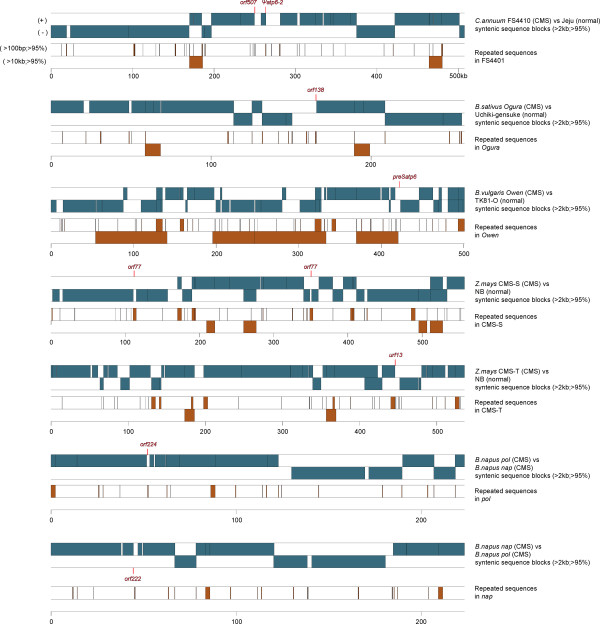
Results: We obtained the complete mitochondrial genome sequences of the pepper CMS line FS4401 (507,452 bp) and the fertile line Jeju (511,530 bp). Comparative analysis between mitochondrial genomes of peppers and tobacco that are included in Solanaceae revealed extensive DNA rearrangements and poor conservation in non-coding DNA. In comparison between pepper lines, FS4401 and Jeju mitochondrial DNAs contained the same complement of protein coding genes except for one additional copy of an atp6 gene (ψatp6-2) in FS4401. In terms of genome structure, we found eighteen syntenic blocks in the two mitochondrial genomes, which have been rearranged in each genome. By contrast, sequences between syntenic blocks, which were specific to each line, accounted for 30,380 and 17,847 bp in FS4401 and Jeju, respectively. The previously-reported CMS candidate genes, orf507 and ψatp6-2, were located on the edges of the largest sequence segments that were specific to FS4401. In this region, large number of small sequence segments which were absent or found on different locations in Jeju mitochondrial genome were combined together. The incorporation of repeats and overlapping of connected sequence segments by a few nucleotides implied that extensive rearrangements by homologous recombination might be involved in evolution of this region. Further analysis using mtDNA pairs from other plant species revealed common features of DNA regions around CMS-associated genes.
Conclusions: Although large portion of sequence context was shared by mitochondrial genomes of CMS and male-fertile pepper lines, extensive genome rearrangements were detected. CMS candidate genes located on the edges of highly-rearranged CMS-specific DNA regions and near to repeat sequences. These characteristics were detected among CMS-associated genes in other species, implying a common mechanism might be involved in the evolution of CMS-associated genes.
Figures

Similar articles
-
Mitochondrial cytochrome c oxidase and F1Fo-ATPase dysfunction in peppers (Capsicum annuum L.) with cytoplasmic male sterility and its association with orf507 and Ψatp6-2 genes.Int J Mol Sci. 2013 Jan 7;14(1):1050-68. doi: 10.3390/ijms14011050. Int J Mol Sci. 2013. PMID: 23296278 Free PMC article.
-
Candidate Gene Selection for Cytoplasmic Male Sterility in Pepper (Capsicum annuum L.) through Whole Mitochondrial Genome Sequencing.Int J Mol Sci. 2019 Jan 29;20(3):578. doi: 10.3390/ijms20030578. Int J Mol Sci. 2019. PMID: 30699994 Free PMC article.
-
Comparative analysis of mitochondrial genomes between a wheat K-type cytoplasmic male sterility (CMS) line and its maintainer line.BMC Genomics. 2011 Mar 29;12:163. doi: 10.1186/1471-2164-12-163. BMC Genomics. 2011. PMID: 21443807 Free PMC article.
-
Triticeae genome sequences reveal huge expansions of gene families implicated in fertility restoration.Curr Opin Plant Biol. 2022 Apr;66:102166. doi: 10.1016/j.pbi.2021.102166. Epub 2022 Jan 10. Curr Opin Plant Biol. 2022. PMID: 35021148 Review.
-
A multidisciplinary and integrative review of the structural genome and epigenome of Capsicum L. species.Planta. 2025 Mar 9;261(4):82. doi: 10.1007/s00425-025-04653-w. Planta. 2025. PMID: 40057910 Review.
Cited by
-
Organelle genome composition and candidate gene identification for Nsa cytoplasmic male sterility in Brassica napus.BMC Genomics. 2019 Nov 6;20(1):813. doi: 10.1186/s12864-019-6187-y. BMC Genomics. 2019. PMID: 31694534 Free PMC article.
-
Organellar genome analysis reveals endosymbiotic gene transfers in tomato.PLoS One. 2018 Sep 5;13(9):e0202279. doi: 10.1371/journal.pone.0202279. eCollection 2018. PLoS One. 2018. PMID: 30183712 Free PMC article.
-
Characterization and phylogenetic analysis of the complete mitochondrial genome sequence of Diospyros oleifera, the first representative from the family Ebenaceae.Heliyon. 2022 Jul 6;8(7):e09870. doi: 10.1016/j.heliyon.2022.e09870. eCollection 2022 Jul. Heliyon. 2022. PMID: 35847622 Free PMC article.
-
Rapid evolutionary divergence of Gossypium barbadense and G. hirsutum mitochondrial genomes.BMC Genomics. 2015 Oct 12;16:770. doi: 10.1186/s12864-015-1988-0. BMC Genomics. 2015. PMID: 26459858 Free PMC article.
-
Inheritance of chloroplast and mitochondrial genomes in cucumber revealed by four reciprocal F1 hybrid combinations.Sci Rep. 2021 Jan 28;11(1):2506. doi: 10.1038/s41598-021-81988-w. Sci Rep. 2021. PMID: 33510273 Free PMC article.
References
-
- Andre C, Levy A, Walbot V. Small repeated sequences and the structure of plant mitochondrial genomes. Trends Genet. 1992;8:128–132. - PubMed
Publication types
MeSH terms
Substances
LinkOut - more resources
Full Text Sources
Other Literature Sources
Molecular Biology Databases
Miscellaneous
