. 2014;19(7):76004.
doi: 10.1117/1.JBO.19.7.076004.

Three-dimensional correction of conduction velocity in the embryonic heart using integrated optical mapping and optical coherence tomography

Affiliations

Three-dimensional correction of conduction velocity in the embryonic heart using integrated optical mapping and optical coherence tomography

Pei Ma et al. J Biomed Opt. 2014.

Abstract

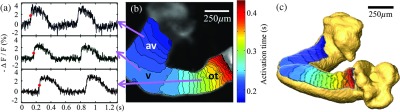
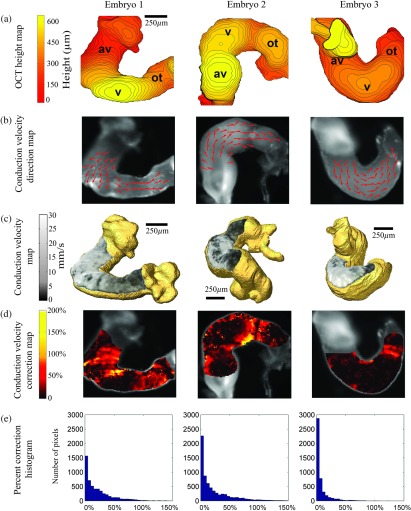
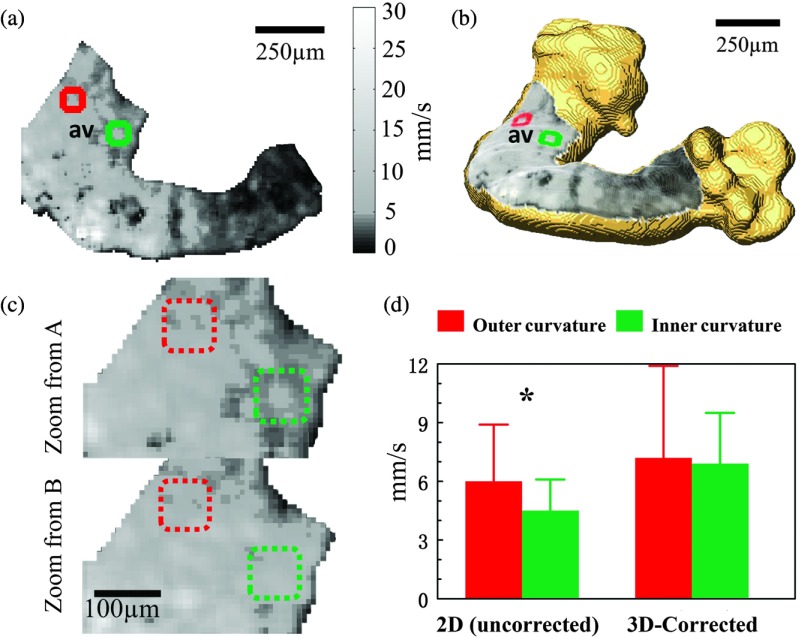
Optical mapping (OM) of cardiac electrical activity conventionally collects information from a three-dimensional (3-D) surface as a two-dimensional (2-D) projection map. When applied to measurements of the embryonic heart, this method ignores the substantial and complex curvature of the heart surface, resulting in significant errors when calculating conduction velocity, an important electrophysiological parameter. Optical coherence tomography (OCT) is capable of imaging the 3-D structure of the embryonic heart and accurately characterizing the surface topology. We demonstrate an integrated OCT/OM imaging system capable of simultaneous conduction mapping and 3-D structural imaging. From these multimodal data, we obtained 3-D activation maps and corrected conduction velocity maps of early embryonic quail hearts. 3-D correction eliminates underestimation bias in 2-D conduction velocity measurements, therefore enabling more accurate measurements with less experimental variability. The integrated system will also open the door to correlate the structure and electrophysiology, thereby improving our understanding of heart development.


Figures

Fig. 1
Fig. 1
Schematic diagram of the integrated OCT/OM system. SLD: superluminescent diode. LED: light-emitting diode.
Fig. 2
Fig. 2
Diagram illustrating velocity calculations with the conventional 2-D projection method (top) and 3-D corrected method (bottom). Fluorescent signals were collected from a 3-D heart surface and projected to a 2-D plane. This diagram uses a small 3×3 region on the heart surface to illustrate the process. In the conventional 2-D calculation, only velocity components in the projected plane (vx,vy) were calculated. In the 3-D corrected calculation, 3-D structure was used to find the normal vector (n) by Newell’s method. Then, the velocity component in the height dimension (vz) was calculated and finally 3-D conduction velocity (v3D) was computed.
Fig. 3
Fig. 3
OCT/OM registration. Panel (a) shows an OCT en face projection grayscale image of a HH stage 15 embryonic heart before being registered to an OM image. The green contour represents the boundary segmentation of the OCT en face projection and the magenta contour represents the boundary segmentation of the corresponding OM image overlaid on the OCT en face projection. Panel (b) shows an OM image which served as the reference for image registration. After registration, boundary contours of OCT (green) and OM (magenta) images can be seen to correspond well.
Fig. 4
Fig. 4
Results of OCT measuring various orientations of a flat surface using Newell’s method. Error bars inside each circle represent standard deviation from 15 repeated measurements.
Fig. 5
Fig. 5
Panel (a) shows raw AP traces of three different pixels from three different regions of the heart tube, indicated by arrows from panel (b). ΔF/F represents the percent change in raw fluorescence signals. The red dot in each trace represents the activation time. The 0 s on the time axis is arbitrary, but chosen to show two complete cycles in each trace. The time scale is the same in each trace; therefore, the activation time delay between traces is preserved. Panel (b) shows a 2-D electrical activation map overlaid on a grayscale OM image. Color map blue to red represents the sequence of activation from early to late. Each isochrone represents 10 ms. Panel (c) shows the activation map overlaid on the 3-D OCT volume surface rendering. This panel shares the same color map as Panel (b). av- atrioventricular junction; v-ventricle; and ot-outflow tract.
Fig. 6
Fig. 6
Three embryonic hearts were imaged and processed. Panel (a) shows the surface height maps acquired from volumetric OCT images. The relative height of each pixel in microns is represented by the color map and each contour line represents 15 μm. Panel (b) shows quiver maps of conduction direction through the hearts. Normalized and 10×10 binned arrow heads indicate the directionality only. Panel (c) shows 3-D-corrected conduction velocity maps overlaid on the surfaces of 3-D OCT volume rendering. Panel (d) shows conduction velocity magnitude correction maps indicating percent correction from the 2-D values to the 3-D-corrected values. Panel (e) shows histograms of the necessary correction amount needed for each heart with bins of 5%. av- atrioventricular junction; v-ventricle; and ot-outflow tract.
Fig. 7
Fig. 7
Panels (a) and (b) are 2-D (uncorrected) and 3-D-corrected conduction velocity maps, respectively, for embryonic heart 1. Square regions of interest from the right (indicated in green) and left (indicated in red) sides were selected for comparison. Panel (c) top and bottom are magnified, corresponding images of the AVJ from panels (a) and (b). Panel (d) shows the conduction velocity (mean±standard deviation) computed from 109 pixels of each marked region in panel (c). Conduction velocity values were compared using Student’s t-test (* significant). av- atrioventricular junction.

Similar articles

Cited by

References

    1. Sedmera D., “Form follows function: developmental and physiological view on ventricular myocardial architecture,” Eur. J. Cardio-Thorac. Surg. 28(4), 526–528 (2005).10.1016/j.ejcts.2005.07.001 - DOI - PMC - PubMed
    1. Mikawa T., Hurtado R., “Development of the cardiac conduction system,” Semin. Cell. Dev. Biol. 18(1), 90–100 (2007).10.1016/j.semcdb.2006.12.008 - DOI - PubMed
    1. Chi N. C., et al. , “Cardiac conduction is required to preserve cardiac chamber morphology,” Proc. Natl. Acad. Sci. 107(33), 14662–14667 (2010).PMASAX10.1073/pnas.0909432107 - DOI - PMC - PubMed
    1. Reckova M., et al. , “Hemodynamics is a key epigenetic factor in development of the cardiac conduction system,” Circ. Res. 93(1), 77–85 (2003).CIRUAL10.1161/01.RES.0000079488.91342.B7 - DOI - PubMed
    1. Rentschler S., et al. , “Visualization and functional characterization of the developing murine cardiac conduction system,” Development 128(10), 1785–1792 (2001).68KCAI - PMC - PubMed

Publication types