. 2014 Aug 18;33(16):1815-30.
doi: 10.15252/embj.201488147. Epub 2014 Jul 4.

NuMA interacts with phosphoinositides and links the mitotic spindle with the plasma membrane

Affiliations

NuMA interacts with phosphoinositides and links the mitotic spindle with the plasma membrane

Sachin Kotak et al. EMBO J. .

Abstract

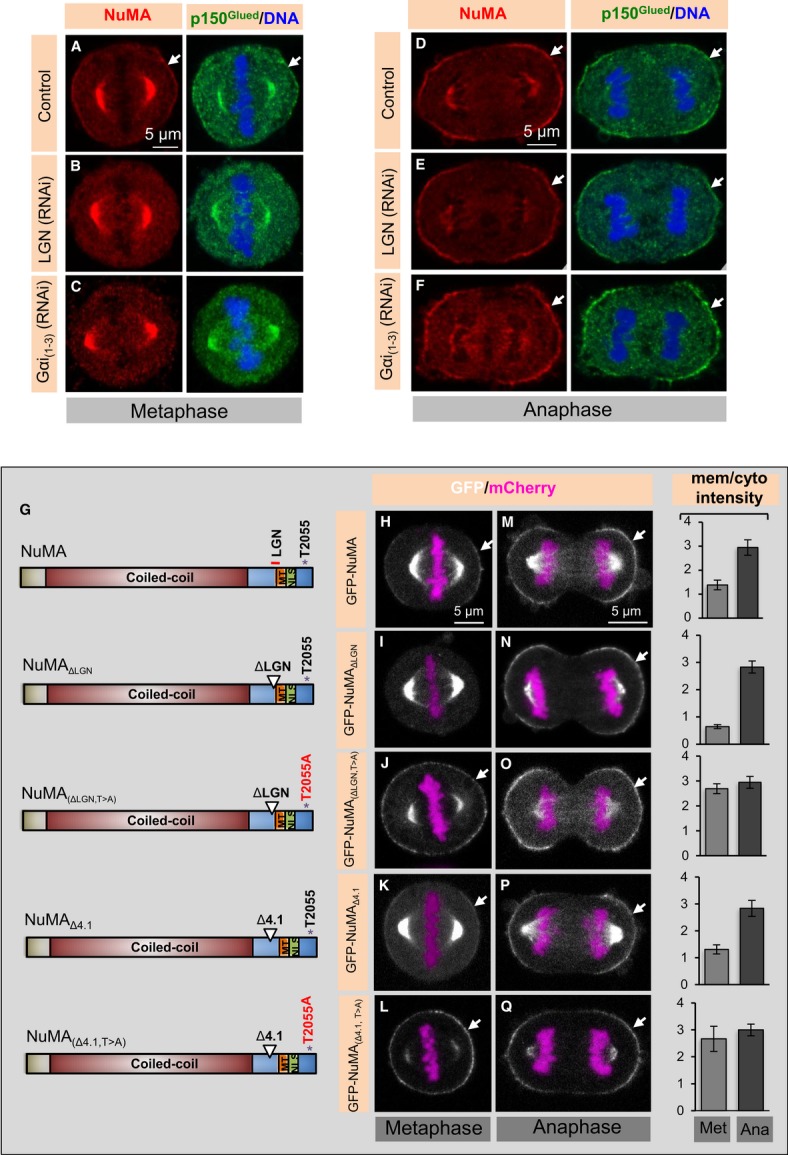
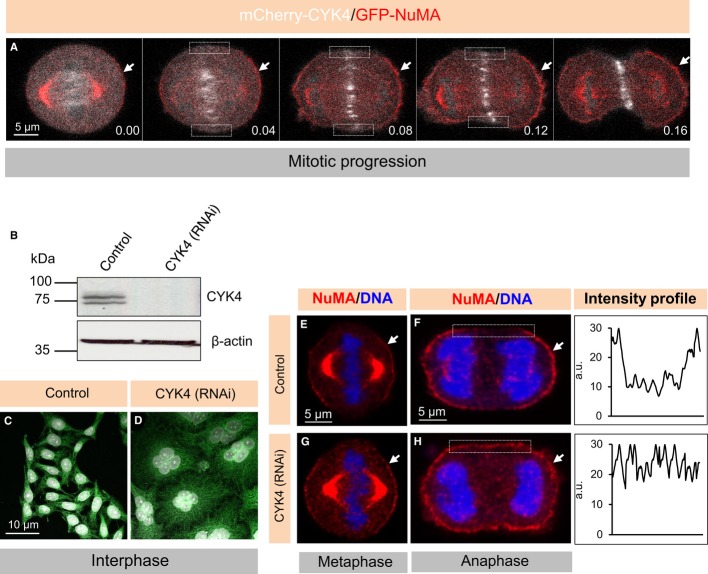
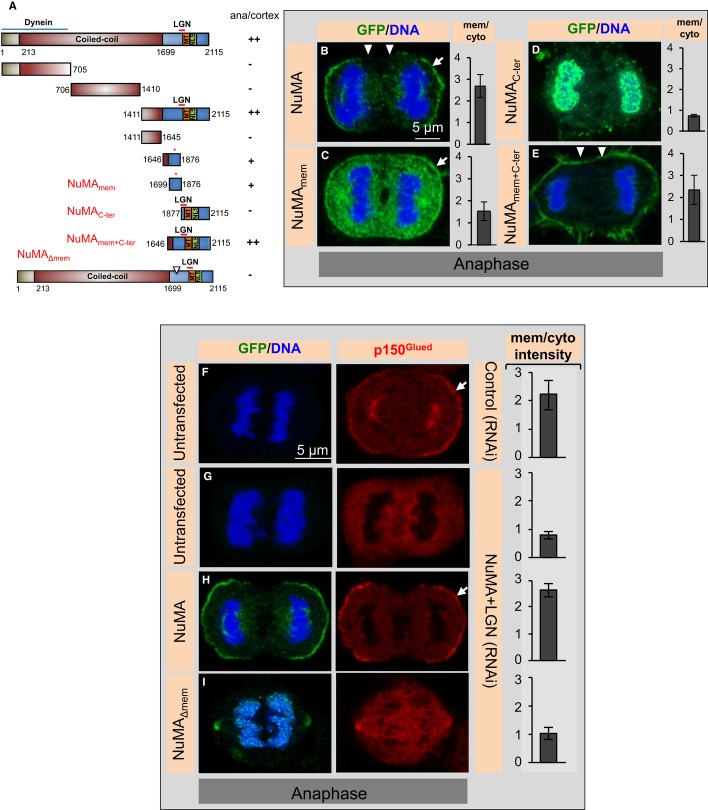
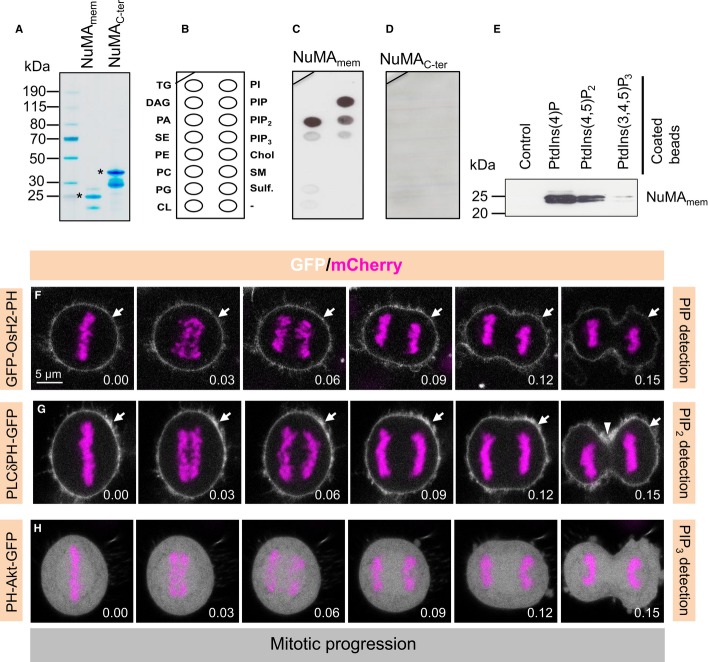
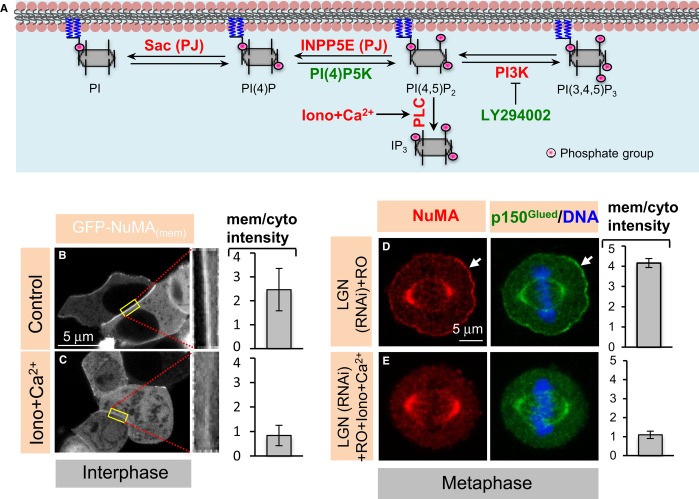
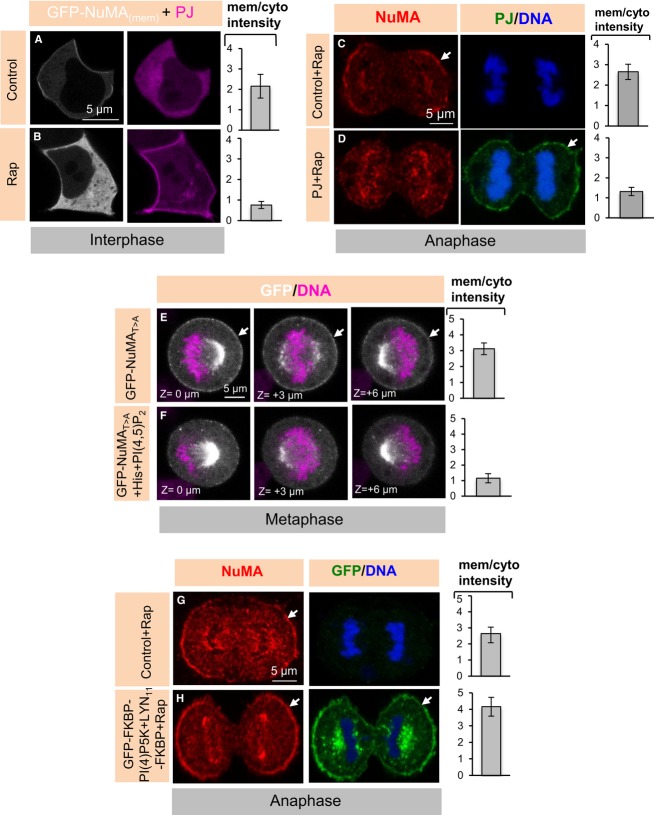
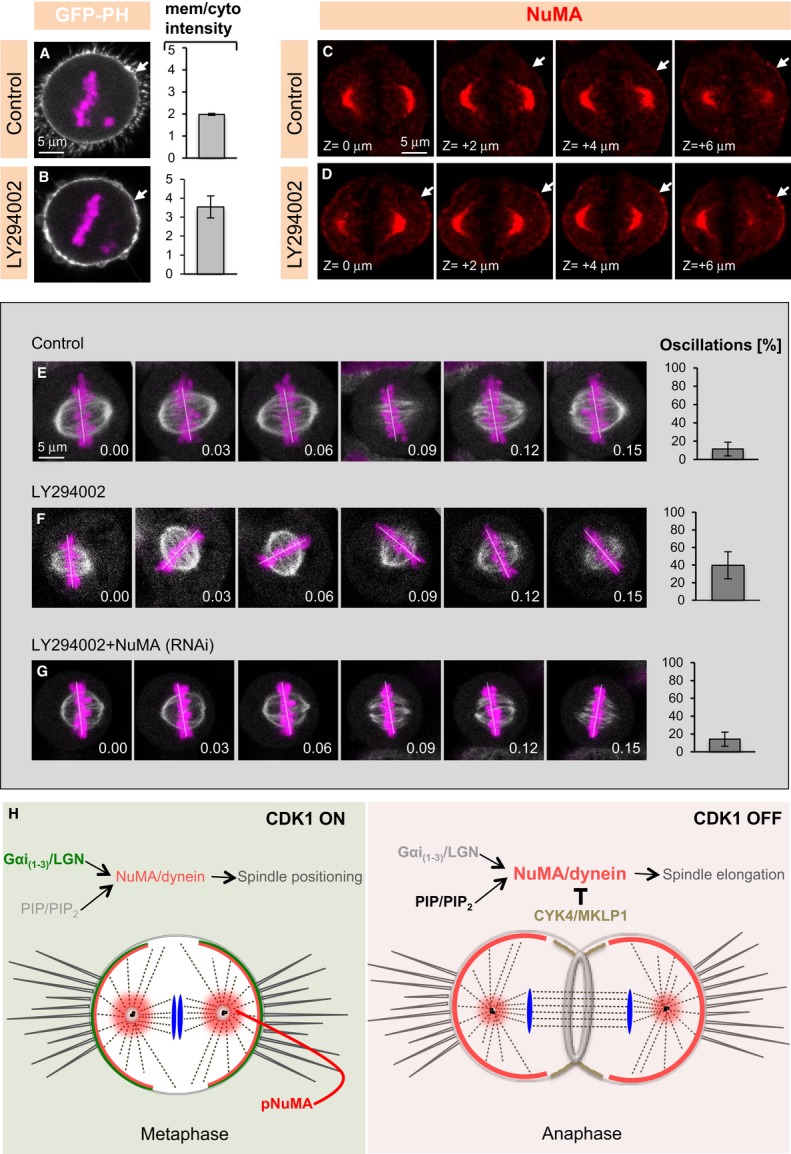
The positioning and the elongation of the mitotic spindle must be carefully regulated. In human cells, the evolutionary conserved proteins LGN/Gαi1-3 anchor the coiled-coil protein NuMA and dynein to the cell cortex during metaphase, thus ensuring proper spindle positioning. The mechanisms governing cortical localization of NuMA and dynein during anaphase remain more elusive. Here, we report that LGN/Gαi1-3 are dispensable for NuMA-dependent cortical dynein enrichment during anaphase. We further establish that NuMA is excluded from the equatorial region of the cell cortex in a manner that depends on the centralspindlin components CYK4 and MKLP1. Importantly, we reveal that NuMA can directly associate with PtdInsP (PIP) and PtdInsP2 (PIP2) phosphoinositides in vitro. Furthermore, chemical or enzymatic depletion of PIP/PIP2 prevents NuMA cortical localization during mitosis, and conversely, increasing PIP2 levels augments mitotic cortical NuMA. Overall, our study uncovers a novel function for plasma membrane phospholipids in governing cortical NuMA distribution and thus the proper execution of mitosis.

Keywords: NuMA; dynein; phosphoinositides; spindle elongation; spindle positioning.


Figures

Figure 1
Figure 1. Anaphase cortical NuMA/dynein localization is LGN/Gαi(1-3) independent
A–F HeLa cells in metaphase or anaphase, as indicated, transfected with control siRNAs (A, D), siRNAs against LGN (B, E) or Gαi(1-3) (C, F), fixed 72 h thereafter and stained for NuMA (red) as well as p150Glued (green). In this and other figures, DNA is visualized in blue and arrows point to cortical localization. In metaphase, 95% of control cells exhibited weak cortical p150Glued staining, as shown, but this was the case for only 2% of LGN (RNAi) and 5% of Gαi(1-3) (RNAi) cells, respectively. In anaphase, 100% of control cells, 98% of LGN (RNAi) cells, and 96% of Gαi(1-3) (RNAi) cells exhibited strong cortical NuMA/p150Glued signal as shown (n > 100 cells for all cases). G Schematic representation of NuMA constructs used for the experiments shown on the right; the coiled-coil domain, the regions mediating interaction with LGN and microtubules (MT), the nuclear localization signal (NLS) and T2055 are represented. H–Q Images from time-lapse microscopy of HeLa cells stably expressing mCherry-H2B and transfected with GFP-NuMA (H, M), GFP-NuMAΔLGN (I, N), GFP-NuMA(ΔLGN, T>A) (J, O), GFP-NuMAΔ4.1 (K, P) or GFP-NuMA(Δ4.1, T>A) (L, Q) in cells depleted of endogenous NuMA by RNAi for 72 h. The GFP signal is shown in white, the mCherry signal in pink. 4% of cells transfected with GFP-NuMA(ΔLGN) exhibited cortical GFP localization in metaphase, whereas 100% of such cells exhibited strong cortical GFP localization in anaphase. GFP-NuMA(ΔLGN, T>A) localizes to the cell cortex during metaphase in 100% of cells. Metaphase and anaphase cells expressing GFP-NuMA(Δ4.1) harbor GFP signal at the cortex similar to wild-type NuMA in 98% of the cells; note also that GFP-NuMA(Δ4.1, T>A) is strongly enriched at the plasma membrane already in metaphase. More than 50 cells were analysed by visual inspection in each case. Moreover, quantification of cortical enrichment is shown on the right for metaphase (Met) and anaphase (Ana) for 10 cells in each condition; see Materials and Methods (< 0.0005 between metaphase and anaphase for GFP-NuMA, GFP-NuMAΔLGN, or GFP-NuMA(Δ4.1); = 0.7 and = 0.1 between metaphase and anaphase for GFP-NuMA(ΔLGN, T>A) and GFP-NuMA(Δ4.1, T>A), respectively; error bars, s.d.).
Figure 2
Figure 2. CYK4 prevents NuMA localization in the cortical equatorial region
A Images from time-lapse recordings of a HeLa Kyoto cell transfected with GFP-NuMA and mCherry-CYK4 (see also corresponding Supplementary Movie S1). Arrows point to cortical NuMA localization and rectangles highlight weak CYK4 signal of CYK4 on the plasma membrane. Note that NuMA and CYK4 occupy mutually exclusive cortical regions. Time is indicated in [hours].[minutes], with t = 0 corresponding to the onset of the recording. B Western blot with CYK4 antibodies of lysates from cells treated with control siRNAs or CYK4 siRNAs and synchronized in prometaphase with 100 nM nocodazole. β-actin was used as a loading control. Molecular weights are indicated in kiloDalton (kDa). Note that the specific CYK4 signal appears as a doublet. C, D Interphase cells transfected with control siRNAs (C) or CYK4 siRNAs (D), fixed 72 h thereafter and stained for microtubules (green). DNA is visualized in white. Note accumulation of multi-nucleated cells in CYK4-depleted cells, indicating cytokinesis failure. 90% of the cells transfected with CYK4 are multi-nucleated in contrast to 2% in the control condition (n > 200). E–H Metaphase and anaphase cells, as indicated, transfected with control siRNAs (E, F) or CYK4 siRNAs (G, H), fixed 48 h thereafter and stained for NuMA (red). Note the presence of NuMA in the cortical equatorial region in CYK4-depleted cells highlighted by the rectangle. The corresponding line scan of pixel intensities (in arbitrary units, a.u. on the y-axis) across the cortical region corresponding to the rectangle within the image is shown for one representative cell per condition. We found that 84% of the cells exhibit NuMA in the equatorial cortical region upon transfection with CYK4 siRNAs compared to 2% in control condition (n = 50 in each case).
Figure 3
Figure 3. A small domain in the C-terminus of NuMA interacts with the plasma membrane
A Schematic representation of NuMA constructs, as in Fig1G. ++ (strong), + (weak), or − (absent) indicates whether the respective GFP-tagged constructs localize to the cortex during anaphase (depicted as ana/cortex). B–E Anaphase cells transfected with GFP-NuMA (aa 1–2115, B), GFP-NuMAmem (aa 1699–1876, C), GFP-NuMAC-ter (aa 1877–2115, D), or GFP-NuMAmem+C-ter (aa 1646–2115, E) for 36 h and stained for GFP (green). More than 20 cells were analysed by visual inspection in each case. Moreover, quantification of cortical enrichment is shown on the right for 10 cells in each condition (error bars, s.d.). Note localization of GFP-NuMAC-ter (aa 1877–2115) to chromosomes, which was observed in all cells for reasons that remain to be determined. Also note the equatorial localization of GFP-NuMAmem+C-ter (marked by arrowheads). F–I Untransfected cells treated with control siRNAs (F) or NuMA siRNAs plus LGN siRNAs (G), as well as cells transfected with GFP-NuMA (H) or with GFP-NuMAΔmem (I) and treated with NuMA plus LGN siRNAs, all stained for GFP (green) and p150Glued (red). More than 23 cells were analysed by visual inspection in each case, and representative image is shown. Note that 60% of the GFP-NuMAΔmem-expressing cells exhibit no apparent GFP signal at the membrane, as shown, 30% weak GFP signal and 10% strong GFP signal, analogous to GFP-NuMA. Note also that GFP-NuMAΔmem-expressing cells show excess blebbing in mitosis. Quantification of anaphase cortical p150Glued enrichment is shown on the right for 10 cells in each condition (< 0.0005 between GFP-NuMA transfected and untransfected cells treated with NuMA plus LGN siRNAs, < 0.005 between GFP-NuMA-transfected and GFP-NuMAΔmem-transfected cells also treated with NuMA plus LGN siRNAs; error bars, s.d.).
Figure 4
Figure 4. NuMA interacts with polyanionic phosphoinositides in vitro and phosphoinositides distribution in mitosis
A Recombinant purified hexa-histidine-tagged NuMAmem (aa 1699–1876) or NuMAC-ter (aa 1877–2115) run on SDS–PAGE and stained with Coomassie blue. Molecular mass is indicated in kiloDaltons (kDa). Note that bacterially expressed NuMAC-ter is unstable, thus explaining the presence of two major species. Asterisks mark expected molecular weight for each species. B–D Lipid arrays (B) incubated with NuMAmem (C) or NuMAC-ter (D) and subsequently probed with anti-His antibodies. Key: triglyceride (TG), diacylglycerole (DAG), phosphatidic acid (PA), phosphatidylserine (PS), phosphatidylethanolamine (PE), phosphatidylcholine (PC), phosphatidylglycerole (PG), cardiolipin (CL), phosphatidylinositol (PI), phosphatidylinositol-4-phosphate PI(4)P, phosphatidylinositol-4,5-bisphosphate [PI(4,5)P2], phosphatidylinositol 3,4,5-triphosphate [PI(3,4,5)P3], cholesterol (Chol.), sphingomyelin (SM), sulfatide (Sulf.). E Pull-down assay using recombinant NuMAmem, incubated with control beads or beads coated with indicated phosphoinositides. Recovered proteins were run on SDS–PAGE and subsequently probed with anti-His antibodies. Molecular mass is indicated in kiloDaltons (kDa). F–H Images from time-lapse microscopy of HeLa cells stably expressing mCherry-H2B and transfected with OsH2-2xPH-GFP (F), PLCδPH-GFP (G), or PH-Akt-GFP (H) (see also corresponding Supplementary Movies S2, S3 and S4). The mCherry signal is shown in pink, the GFP signal in white. Time indicated in [hours].[minutes].
Figure 5
Figure 5. Membrane localization of NuMA depends on PtdIns(4)P and PtdIns(4,5)P2 in vivo
A Schematic representation of the involvement of inhibitors and activators of PIP and PIP2 biosynthesis. Treatments that lead to increases in the levels of PIP and/or PIP2 are shown in green, those that result in corresponding decreases in red. Ionomycin and CaCl2 (Iono + Ca2+) treatment activates phospholipase C and thus decreases the levels of PIP and PIP2. INPP5E and Sac are part of the hybrid lipid phosphatase pseudojanin (PJ), which deplete PIP2 and PIP when targeted to the membrane using Rapamycin-based chemistry (see text for details). PI(4)P5K converts PI(4)P to PI(4,5)P2, thus resulting in increased PtdIns(4,5)P2 levels when targeted to the membrane. LY294002 is a PI3K inhibitor that enriches PIP2 upon PI3K inhibition. B, C HEK293T interphase cells transfected with GFP-NuMAmem recorded before (control) and 200 s after treatment with 10 μM Ionomycin (Iono) and 1 mM CaCl2, with higher magnifications of the cortical regions highlighted by the yellow rectangle. Quantification of cortical enrichment is shown on the right in this and other panels of this figure and Fig6A; see Materials and Methods (P = 0.003; n = 10 cells each; error bars, s.d.). D, E Metaphase HeLa cells transfected with siRNAs against LGN and treated with RO-3306 for 5 min (D) or treated with Ionomycin and CaCl2 (10 min) plus RO-3306 for 5 min (E) and stained for NuMA (red) as well as p150Glued (green) (P < 0.001; n = 10; error bars s.d.). We note also that 98% of LGN (RNAi) and RO-3306-treated cells exhibited strong cortical NuMA/p150Glued staining, as shown in (D), but this was the case for only 14% of LGN (RNAi); RO-3306; Ionomycin and CaCl2-treated cells (n > 50 cells for all cases).
Figure 6
Figure 6. Membrane localization of NuMA depends on PIP2 and/or PIP phosphoinositides in vivo
A, B HEK293T cells co-transfected with GFP-NuMAmem, Lyn11–FRB, and monomeric red fluorescent protein (mRFP)-FKBP-tagged lipid phosphatases [pseudojanin (PJ); Hammond et al, 2012]. Images were taken before (control) and 200 s after treatment with 10 μM Rapamycin (Rap) (P < 0.001; n = 10; error bars: s.d.). C, D Anaphase HeLa cells either untransfected (C) or co-transfected with Lyn11-CFP-FRB and mRFP-FKBP-tagged lipid phosphatases [pseudojanin (PJ); Hammond et al, 2012] for 36 h (D) and treated with Rapamycin for 10 min thereafter. Cells were fixed and stained for NuMA (red) and CFP to detect PJ (green) (< 0.0005; n = 5 cells each; error bars, s.d.). Note that we could only obtain very few mitotic cells expressing PJ and also that we noticed a major incidence of apoptosis in PJ-expressing cells. E, F Images from time-lapse microscopy of HeLa cells stably expressing mCherry-H2B and transfected with GFP-NuMAT>A, and imaged in three confocal sections either at the onset of the experiment (E) or 20 min after addition of PI(4,5)P2—histone complexes (F). The mCherry signal is shown in pink, the GFP signal in white (P = 0.0019; n = 5 cells in each condition; error bars, s.d.). G, H Anaphase HeLa cells either untransfected (G) or co-transfected with YFP-FKBP-PI(4)P5K; LYN11-FRB for 24 h (H) and treated with 10 μM Rapamycin (Rap) for 10 min. Cells were fixed and stained for NuMA (red) and GFP (green) (P = 0.0006; n = 9 in each condition; error bars: s.d.). Note that only very few mitotic cells expressing GFP-FKBP-PI(4)P5K during mitosis could be obtained, suggesting that altering phosphoinositide levels in the cytoplasm, prior to Rap addition, impairs cell viability or cell cycle progression.
Figure 7
Figure 7. Premature enrichment of PtdInsP2 (PIP2) causes NuMA-dependent spindle positioning defects
A, B Images from time-lapse microscopy of mitotic HeLa cells stably expressing mCherry-H2B and transfected with the PIP2-specific marker (PLCδPH-GFP) either treated with DMSO (Control) (A) or treated with 100 μM of the PI3K inhibitor LY294002 (B). Quantification of GFP cortical signal (right) was determined as mentioned in Materials and Methods. The mCherry signal is shown in pink and the GFP signal in white (P = 0.005; n = 10 cells in each condition; error bars, s.d.). C, D Z-projection of images 2 μm apart of metaphase cell treated with DMSO (Control) or LY294002 and stained for NuMA (red). See corresponding Supplementary Movies S5 and S6 of the entire z-stack. 50 cells were analysed for each condition and representative results shown here. E–G Images from time-lapse recordings of metaphase HeLa Kyoto cells stably expressing GFP-α-tubulin as well as mCherry-H2B (E) and treated with DMSO (Control) (E), LY294002 (F), and depleted of NuMA plus treated with LY294002 (G) (see also corresponding Supplementary Movies S7, S8, and S9). The white line indicates the position of chromosomes. Ten cells were imaged for each condition. The bar graphs on the right represent the frequency at which chromosome position changes > 10° between two frames, along with the standard deviation (s.d.). Time is indicated in [hours].[minutes], (< 0.0005 between control (DMSO) and LY294002, as well as between LY294002 and LY294002 plus NuMA (RNAi); error bars, s.d.). H Model for cortical localization of NuMA/dynein during metaphase, and anaphase. During metaphase, when CDK1 is active, the LGN/Gαi(1–3)-dependent pathway is responsible for cortical NuMA/dynein localization. By contrast, during anaphase, upon CDK1 inactivation, a PIP- and/or PIP2-based mechanism ensures cortical NuMA/dynein localization. Also note that CYK4/MKLP1 exclude NuMA/dynein from the equatorial cortical region in anaphase.

Similar articles

Cited by

References

    1. Anderson RA, Lovrien RE. Glycophorin is linked by band 4.1 protein to the human erythrocyte membrane skeleton. Nature. 1984;307:655–658. - PubMed
    1. Baines AJ, Lu HC, Bennett PM. The Protein 4.1 family: hub proteins in animals for organizing membrane proteins. Biochim Biophys Acta. 2014;1838:605–619. - PubMed
    1. Bastos RN, Penate X, Bates M, Hammond D, Barr FA. CYK4 inhibits Rac1-dependent PAK1 and ARHGEF7 effector pathways during cytokinesis. J Cell Biol. 2012;198:865–880. - PMC - PubMed
    1. Bird SL, Heald R, Weis K. RanGTP and CLASP1 cooperate to position the mitotic spindle. Mol Biol Cell. 2013;24:2506–2514. - PMC - PubMed
    1. Canman JC, Lewellyn L, Laband K, Smerdon SJ, Desai A, Bowerman B, Oegema K. Inhibition of Rac by the GAP activity of centralspindlin is essential for cytokinesis. Science. 2008;322:1543–1546. - PMC - PubMed

Publication types

MeSH terms