

Trends in prevalence of diabetes among delivery hospitalizations, United States, 1993-2009
- PMID: 24996952
- PMCID: PMC4527040
- DOI: 10.1007/s10995-014-1553-5
Trends in prevalence of diabetes among delivery hospitalizations, United States, 1993-2009
Abstract
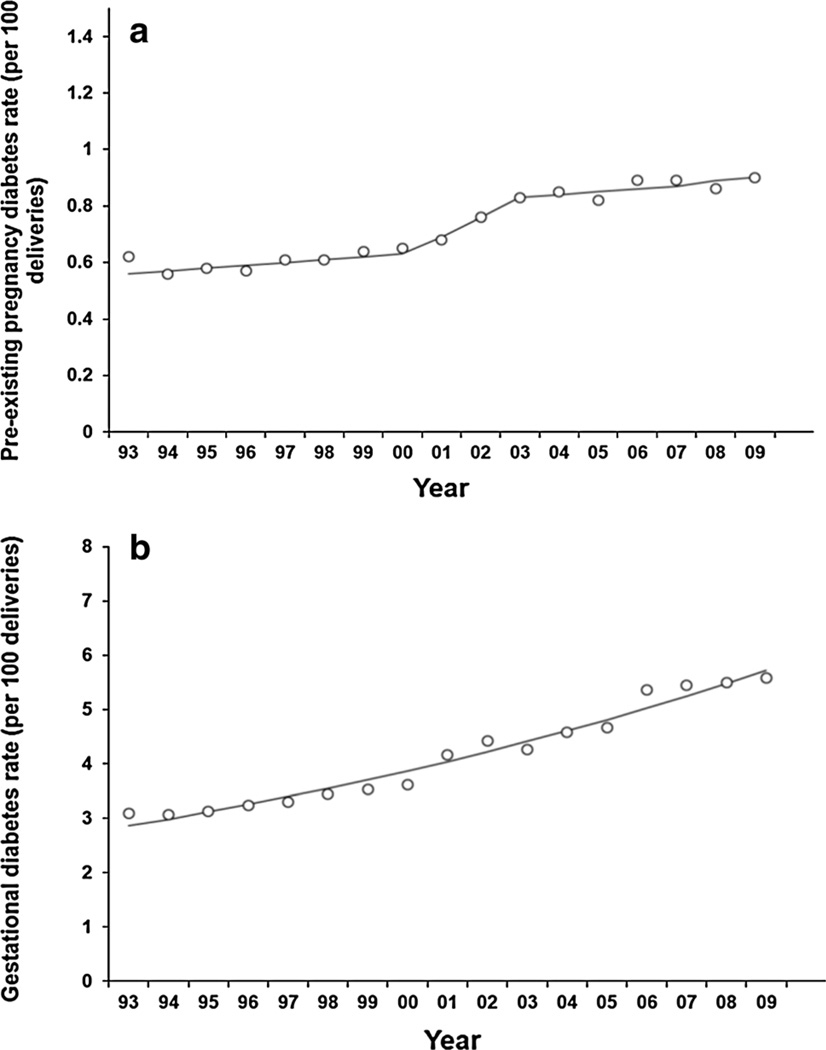
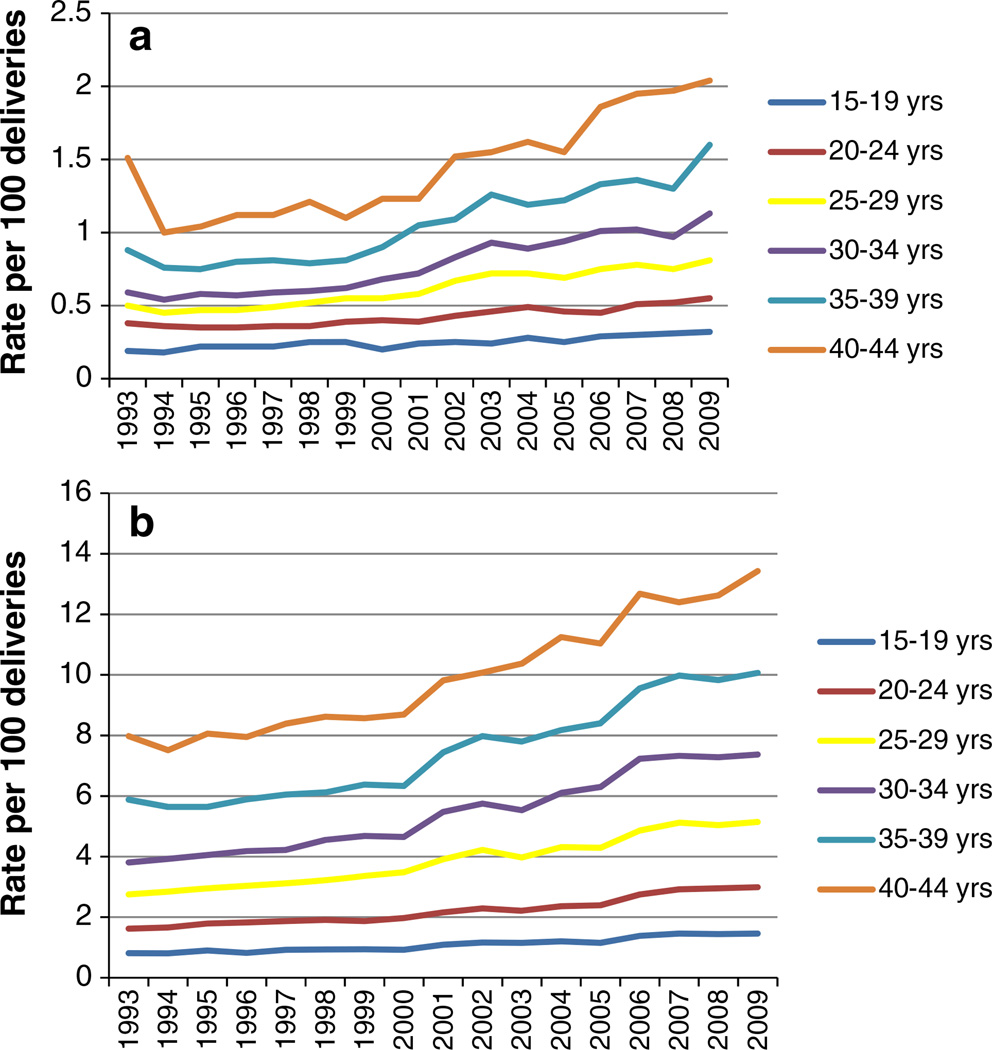
To describe recent trends in prevalence of pre-existing diabetes mellitus (PDM) (i.e., type 1 or type 2 diabetes) and gestational diabetes mellitus (GDM) among delivery hospitalizations in the United States. Data on delivery hospitalizations from 1993 through 2009 were obtained from the Health Care Cost and Utilization Project (HCUP) Nationwide Inpatient Sample. Diagnosis-Related Group codes were used to identify deliveries and diagnosis codes on presence of diabetes. Rates of hospitalizations with diabetes were calculated per 100 deliveries by type of diabetes, hospital geographic region, patient's age, degree of urbanicity of patient's residence, categorized median household income for patient's ZIP Code, expected primary payer, and type of delivery. From 1993 to 2009, age-standardized prevalence of diabetes per 100 deliveries increased from 0.62 to 0.90 for PDM (trend p < 0.001) and from 3.09 to 5.57 for GDM (trend p < 0.001). In 2009, correlates of PDM at delivery included older age [40-44 vs. 15-24: odds ratio 6.45 (95 % CI 5.27-7.88)], Medicaid/Medicare versus private payment sources [1.77 (95 % CI 1.59-1.98)], patient's ZIP Code with a median household income in bottom quartile versus other quartiles [1.54 (95 % CI 1.41, 1.69)], and C-section versus vaginal delivery [3.36 (95 % CI 3.10-3.64)]. Correlates of GDM at delivery were similar. Among U.S. delivery hospitalizations, the prevalence of diabetes is increasing. In 2009, the prevalence of diabetes was higher among women in older age groups, living in ZIP codes with lower household incomes, or with public insurance.
Conflict of interest statement
Figures
References
-
- CDC. [cited 2011 August 17];Incidence of diagnosed diabetes per 1,000 population aged 18–79 years, by sex and age, United States, 1997–2009. 2009 http://www.cdc.gov/diabetes/statistics/incidence/fig5.htm.
-
- Balsells M, Garcia-Patterson A, Gich I, Corcoy R. Maternal and fetal outcome in women with type 2 versus type 1 diabetes mellitus: a systematic review and metaanalysis. Journal of Clinical Endocrinology and Metabolism. 2009;94(11):4284–4291. - PubMed
-
- Catalano PM, Ehrenberg HM. The short- and long-term implications of maternal obesity on the mother and her offspring. BJOG. 2006;113(10):1126–1133. - PubMed
-
- Yogev Y, Visser GH. Obesity, gestational diabetes and pregnancy outcome. Seminars in Fetal and Neonatal Medicine. 2009;14(2):77–84. - PubMed
-
- Cedergren MI. Maternal morbid obesity and the risk of adverse pregnancy outcome. Obstetrics and Gynecology. 2004;103(2):219–224. - PubMed
MeSH terms
Grants and funding
LinkOut - more resources
Full Text Sources
Other Literature Sources
Medical
