Influence of the Purkinje-muscle junction on transmural repolarization heterogeneity
- PMID: 24997066
- PMCID: PMC4200054
- DOI: 10.1093/cvr/cvu165
Influence of the Purkinje-muscle junction on transmural repolarization heterogeneity
Abstract
Aims: To elucidate the properties of the PMJ and myocardium underlying these effects. Transmural heterogeneity of action potential duration (APD) is known to play an important role in arrhythmogenesis. Regions of non-uniformities of APD gradients often overlap considerably with the location of Purkinje-muscle junctions (PMJs). We therefore hypothesized that such junctions are novel sources of local endocardial and transmural heterogeneity of repolarization, and that remodelling due to heart failure modulates this response.
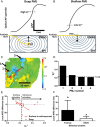
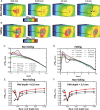
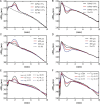
Methods and results: Spatial gradients of endocardial APD in left ventricular wedge preparations from healthy sheep (n = 5) were correlated with locations of PMJs identified through Purkinje stimulation under optical mapping. APD prolongation was dependent on proximity of the PMJ to the imaged surface, whereby shallow PMJs significantly modulated local APD when stimulating either Purkinje (P = 0.0116) or endocardium (P = 0.0123). In addition, we model a PMJ in 5 × 5× 10 mm transmural tissue wedges using healthy and novel failing human ventricular and Purkinje ionic models. Short distances of the PMJ to cut surfaces (<0.875 mm) revealed that APD maxima were localized to the PMJ in healthy myocardium, whereas APD minima were observed in failing myocardium. Amplitudes and spatial gradients of APD were prominent at functional PMJs and quiescent PMJs. Furthermore, increasing the extent of Purkinje fibre branching or decreasing tissue conductivity augmented local APD prolongation in both failing and non-failing models.
Conclusions: The Purkinje network has the potential to influence myocardial AP morphology and rate-dependent behaviour, and furthermore to underlie enhanced transmural APD heterogeneities and spatial gradients of APD in non-failing and failing myocardium.
Keywords: Conduction system; Optical mapping; Purkinje-muscle junction; Repolarization; Transmural heterogeneity.
Published on behalf of the European Society of Cardiology. All rights reserved. © The Author 2014. For permissions please email: journals.permissions@oup.com.
Figures


Similar articles
-
Role of the Purkinje-Muscle Junction on the Ventricular Repolarization Heterogeneity in the Healthy and Ischemic Ovine Ventricular Myocardium.Front Physiol. 2018 Jun 14;9:718. doi: 10.3389/fphys.2018.00718. eCollection 2018. Front Physiol. 2018. PMID: 29962961 Free PMC article.
-
Transmural dispersion of repolarization in failing and nonfailing human ventricle.Circ Res. 2010 Mar 19;106(5):981-91. doi: 10.1161/CIRCRESAHA.109.204891. Epub 2010 Jan 21. Circ Res. 2010. PMID: 20093630 Free PMC article.
-
Effect of activation sequence on transmural patterns of repolarization and action potential duration in rabbit ventricular myocardium.Am J Physiol Heart Circ Physiol. 2010 Dec;299(6):H1812-22. doi: 10.1152/ajpheart.00518.2010. Epub 2010 Oct 1. Am J Physiol Heart Circ Physiol. 2010. PMID: 20889843 Free PMC article.
-
Modulation of transmural repolarization.Ann N Y Acad Sci. 2005 Jun;1047:314-23. doi: 10.1196/annals.1341.028. Ann N Y Acad Sci. 2005. PMID: 16093507 Free PMC article. Review.
-
Transmural dispersion of repolarization and arrhythmogenicity: the Brugada syndrome versus the long QT syndrome.J Electrocardiol. 1999;32 Suppl:158-65. doi: 10.1016/s0022-0736(99)90074-2. J Electrocardiol. 1999. PMID: 10688320 Review.
Cited by
-
Translational Models of Arrhythmia Mechanisms and Susceptibility: Success and Challenges of Modeling Human Disease.Front Cardiovasc Med. 2019 Sep 10;6:135. doi: 10.3389/fcvm.2019.00135. eCollection 2019. Front Cardiovasc Med. 2019. PMID: 31552276 Free PMC article. Review.
-
Acquired Long QT Syndrome and Electrophysiology of Torsade de Pointes.Arrhythm Electrophysiol Rev. 2019 May;8(2):122-130. doi: 10.15420/aer.2019.8.3. Arrhythm Electrophysiol Rev. 2019. PMID: 31114687 Free PMC article. Review.
-
Why Ablation of Sites With Purkinje Activation Is Antiarrhythmic: The Interplay Between Fast Activation and Arrhythmogenesis.Front Physiol. 2021 Mar 23;12:648396. doi: 10.3389/fphys.2021.648396. eCollection 2021. Front Physiol. 2021. PMID: 33833689 Free PMC article.
-
Enhanced optimization-based method for the generation of patient-specific models of Purkinje networks.Sci Rep. 2023 Jul 21;13(1):11788. doi: 10.1038/s41598-023-38653-1. Sci Rep. 2023. PMID: 37479707 Free PMC article.
-
Andrographolide inhibits arrhythmias and is cardioprotective in rabbits.Oncotarget. 2017 May 22;8(37):61226-61238. doi: 10.18632/oncotarget.18051. eCollection 2017 Sep 22. Oncotarget. 2017. PMID: 28977859 Free PMC article.
References
-
- Antzelevitch C, Sicouri S, Litovsky SH, Lukas A, Krishnan SC, Di Diego JM, Gintant GA, Liu DW. Heterogeneity within the ventricular wall. Electrophysiology and pharmacology of epicardial, endocardial, and M cells. Circ Res. 1991;69:1427–1449. - PubMed
-
- Nerbonne JM, Kass RS. Molecular physiology of cardiac repolarization. Physiol Rev. 2005;85:1205–1253. - PubMed
-
- Antzelevitch C, Fish J. Electrical heterogeneity within the ventricular wall. Basic Res Cardiol. 2001;96:517–527. - PubMed
-
- Rouzioux JM. Who is responsible for what? Fundam Clin Pharmacol. 1990;4(Suppl 2):183s–187s. - PubMed
Publication types
MeSH terms
Grants and funding
LinkOut - more resources
Full Text Sources
Other Literature Sources

