

Amino acid-induced impairment of insulin sensitivity in healthy and obese rats is reversible
- PMID: 24997070
- PMCID: PMC4187556
- DOI: 10.14814/phy2.12067
Amino acid-induced impairment of insulin sensitivity in healthy and obese rats is reversible
Abstract
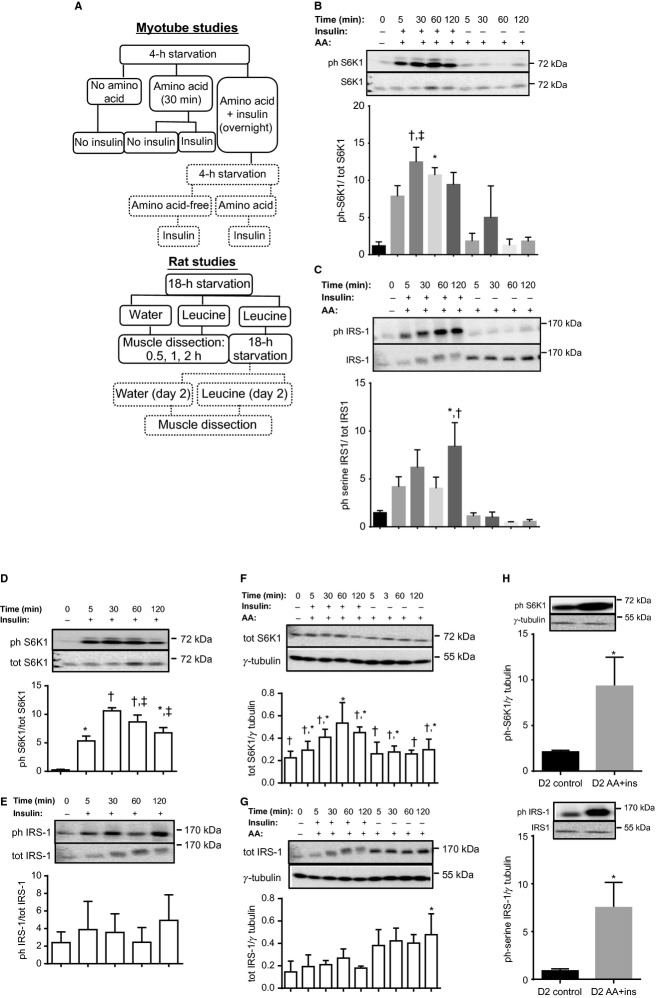
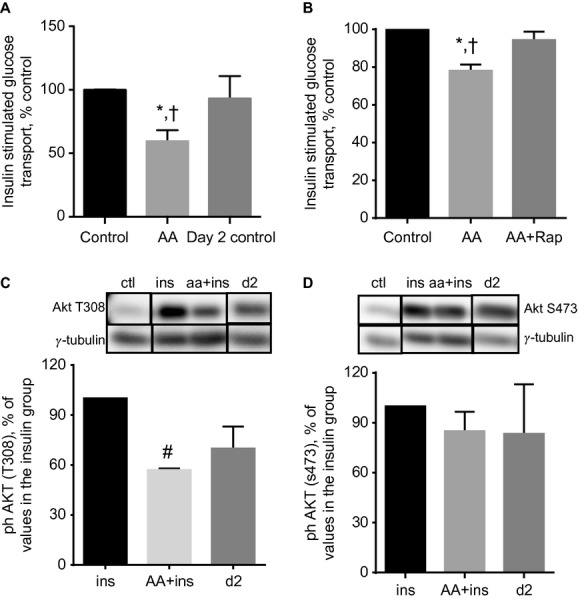
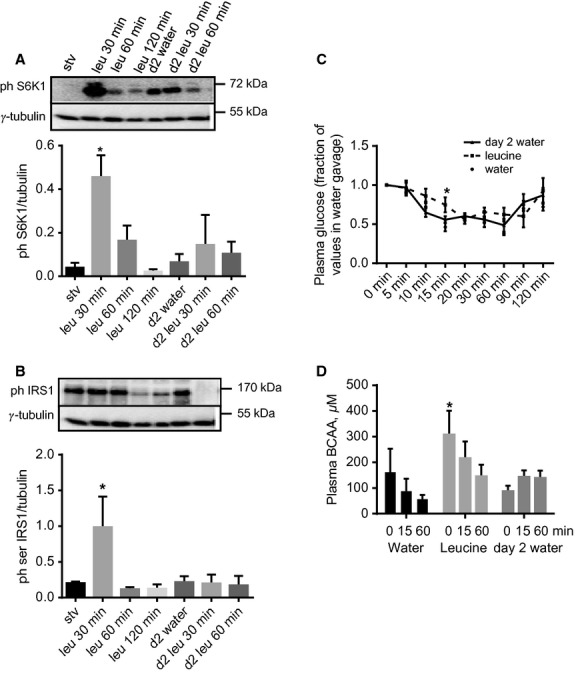
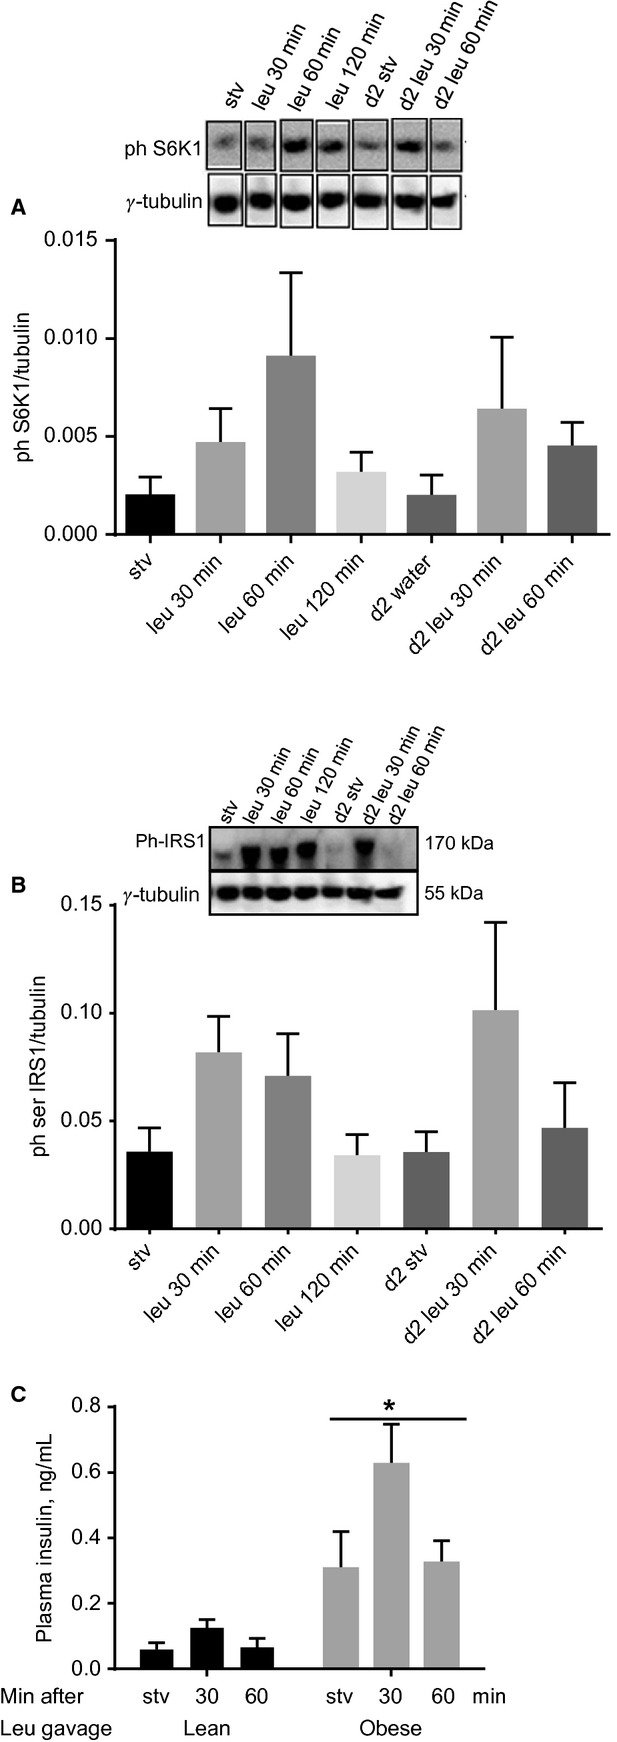
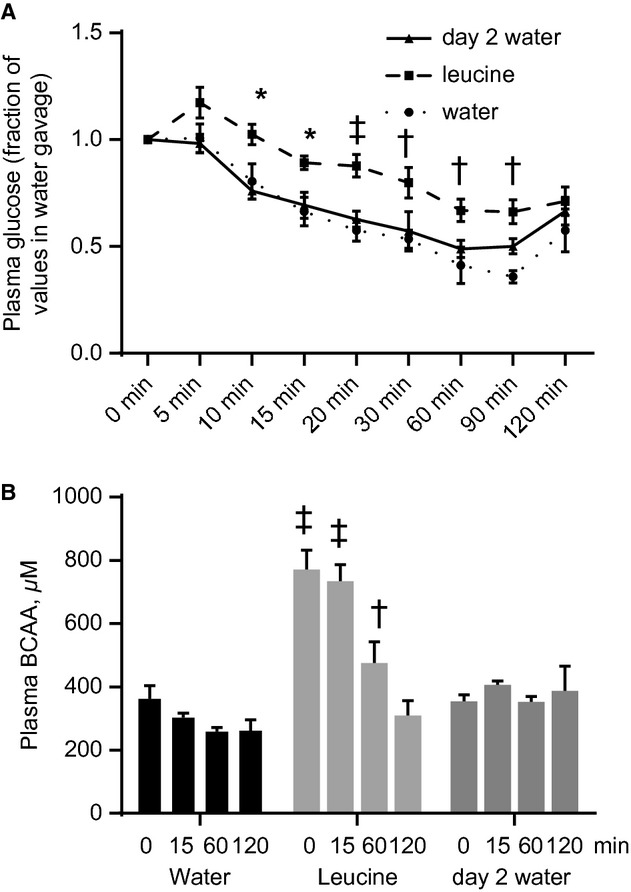
High-protein diets (HPDs) promote weight loss but other studies implicate these diets and their constituent amino acids (AAs) in insulin resistance. We hypothesized that AA-induced insulin resistance is a temporal and reversible metabolic event. L6 myotubes were serum deprived for 4 h and then incubated in AA and/or insulin (100 nmol/L). Another group of cells was incubated overnight in AA + insulin, starved again, and then reincubated with AA and insulin. Mammalian (mechanistic) target of rapamycin complex 1 (mTORC1) signaling and glucose uptake were then measured. Healthy or insulin-resistant rats were gavaged with leucine (0.48 g/kg) and insulin sensitivity was examined. In myotubes, incubation with AA and insulin significantly (P < 0.05) increased the phosphorylation of the mTORC1 substrate ribosomal protein S6 kinase 1 (S6K1, T389) and of insulin receptor substrate 1 (IRS-1, serine residues), but suppressed insulin-stimulated glucose uptake by 40% (P < 0.01). These modifications were mTORC1-dependent and were reversible. In vivo, leucine gavage reversibly increased S6K1 phosphorylation and IRS-1 serine phosphorylation 5- to 12-fold in skeletal muscle and impaired insulin tolerance of glucose (P < 0.05) in lean rats. In insulin-resistant rats, the impairment of whole blood glucose and AA metabolism induced by leucine gavage (0.001 < P < 0.05) was more severe than that observed in lean rats; however, the impairment was reversible within 24 h of treatment. If these data are confirmed in long-term studies, it would imply that the use of leucine/HPD in treating metabolic diseases is unlikely to have lasting negative effects on insulin sensitivity.
Keywords: Glucose metabolism; insulin resistance; leucine; skeletal muscle.
© 2014 The Authors. Physiological Reports published by Wiley Periodicals, Inc. on behalf of the American Physiological Society and The Physiological Society.
Figures
Similar articles
-
KIC (ketoisocaproic acid) and leucine have divergent effects on tissue insulin signaling but not on whole-body insulin sensitivity in rats.PLoS One. 2024 Aug 20;19(8):e0309324. doi: 10.1371/journal.pone.0309324. eCollection 2024. PLoS One. 2024. PMID: 39163364 Free PMC article.
-
Insulin potentiates essential amino acids effects on mechanistic target of rapamycin complex 1 signaling in MAC-T cells.J Dairy Sci. 2020 Dec;103(12):11988-12002. doi: 10.3168/jds.2020-18920. Epub 2020 Oct 23. J Dairy Sci. 2020. PMID: 33222863
-
Leucine and mTORc1 act independently to regulate 2-deoxyglucose uptake in L6 myotubes.Amino Acids. 2020 Mar;52(3):477-486. doi: 10.1007/s00726-020-02829-0. Epub 2020 Feb 27. Amino Acids. 2020. PMID: 32108266
-
Chronic inhibition of the mTORC1/S6K1 pathway increases insulin-induced PI3K activity but inhibits Akt2 and glucose transport stimulation in 3T3-L1 adipocytes.Mol Endocrinol. 2010 Apr;24(4):766-78. doi: 10.1210/me.2009-0328. Epub 2010 Mar 4. Mol Endocrinol. 2010. PMID: 20203102 Free PMC article.
-
Pharmacological inhibition of S6K1 increases glucose metabolism and Akt signalling in vitro and in diet-induced obese mice.Diabetologia. 2016 Mar;59(3):592-603. doi: 10.1007/s00125-015-3839-6. Epub 2016 Jan 5. Diabetologia. 2016. PMID: 26733005
Cited by
-
Elevated BCAA catabolism reverses the effect of branched-chain ketoacids on glucose transport in mTORC1-dependent manner in L6 myotubes.J Nutr Sci. 2024 Oct 18;13:e66. doi: 10.1017/jns.2024.66. eCollection 2024. J Nutr Sci. 2024. PMID: 39464407 Free PMC article.
-
Systematic analysis of relationships between plasma branched-chain amino acid concentrations and cardiometabolic parameters: an association and Mendelian randomization study.BMC Med. 2022 Dec 15;20(1):485. doi: 10.1186/s12916-022-02688-4. BMC Med. 2022. PMID: 36522747 Free PMC article.
-
Role of branched-chain amino acid metabolism in the pathogenesis of obesity and type 2 diabetes-related metabolic disturbances BCAA metabolism in type 2 diabetes.Nutr Diabetes. 2022 Aug 5;12(1):35. doi: 10.1038/s41387-022-00213-3. Nutr Diabetes. 2022. PMID: 35931683 Free PMC article. Review.
-
Amino Acid-Induced Impairment of Insulin Signaling and Involvement of G-Protein Coupling Receptor.Nutrients. 2021 Jun 29;13(7):2229. doi: 10.3390/nu13072229. Nutrients. 2021. PMID: 34209599 Free PMC article. Review.
-
Effects of ketoisocaproic acid and inflammation on glucose transport in muscle cells.Physiol Rep. 2021 Jan;9(1):e14673. doi: 10.14814/phy2.14673. Physiol Rep. 2021. PMID: 33400857 Free PMC article.
References
-
- Adegoke O. A., Abdullahi A., Tavajohi‐Fini P. 2012. mTORC1 and the regulation of skeletal muscle anabolism and mass. Appl. Physiol. Nutr. Metab.; 37:395-406. - PubMed
-
- Bassil M., Burgos S., Marliss E. B., Morais J. A., Chevalier S., Gougeon R. 2011. Hyperaminoacidaemia at postprandial levels does not modulate glucose metabolism in type 2 diabetes mellitus. Diabetologia; 54:1810-1818. - PubMed
-
- Bugianesi E., Moscatiello S., Ciaravella M. F., Marchesini G. 2010. Insulin resistance in nonalcoholic fatty liver disease. Curr. Pharm. Des.; 16:1941-1951. - PubMed
-
- Chevalier S., Gougeon R., Kreisman S. H., Cassis C., Morais J. A. 2004. The hyperinsulinemic amino acid clamp increases whole‐body protein synthesis in young subjects. Metabolism; 53:388-396. - PubMed
LinkOut - more resources
Full Text Sources
Other Literature Sources
