. 2014 Oct 1;394(1):142-55.
doi: 10.1016/j.ydbio.2014.06.023. Epub 2014 Jul 2.

Inhibition of RHO-ROCK signaling enhances ICM and suppresses TE characteristics through activation of Hippo signaling in the mouse blastocyst

Affiliations

Inhibition of RHO-ROCK signaling enhances ICM and suppresses TE characteristics through activation of Hippo signaling in the mouse blastocyst

Kanako Kono et al. Dev Biol. .

Abstract

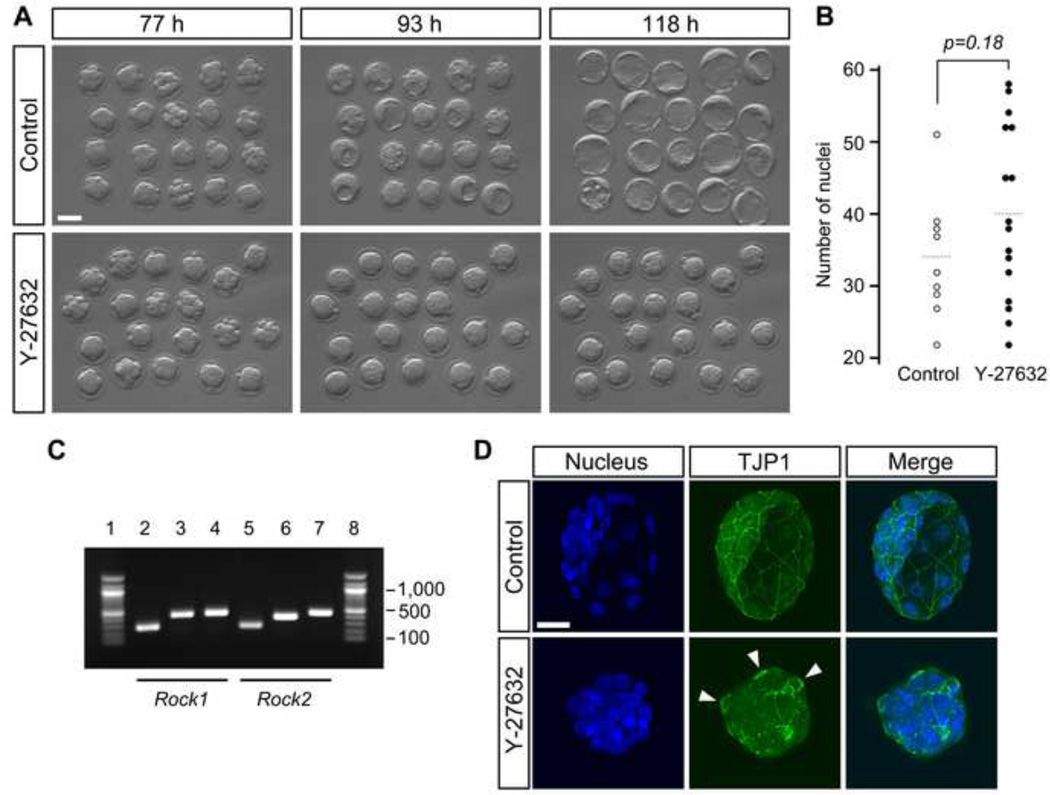
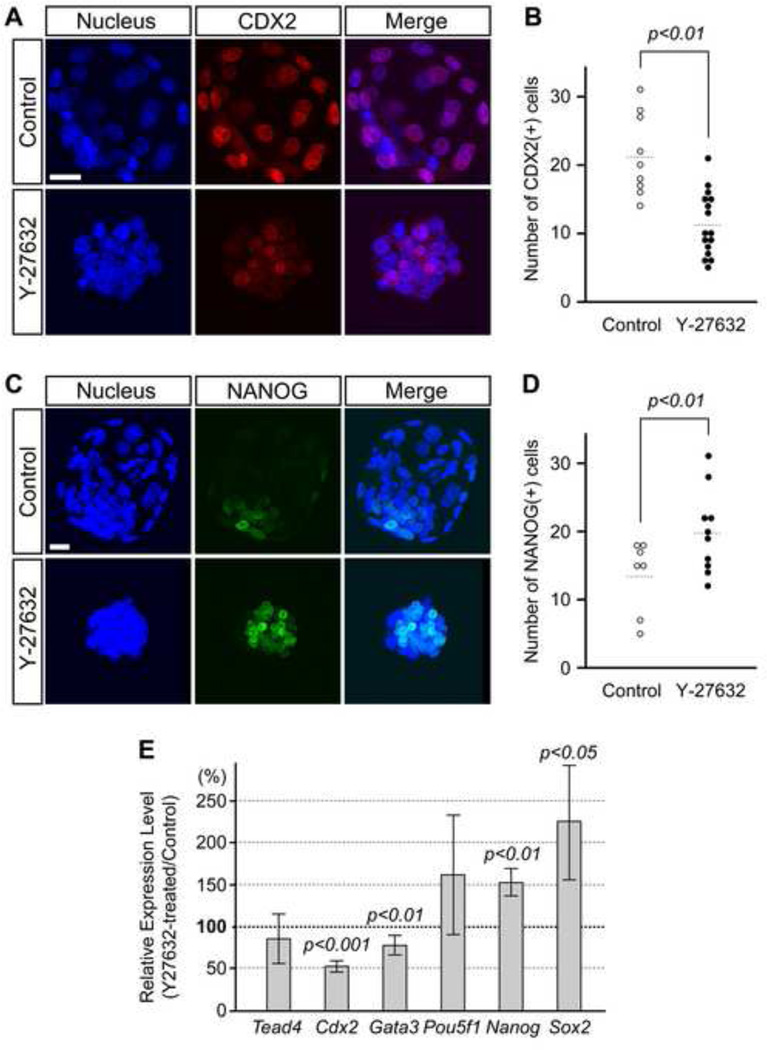
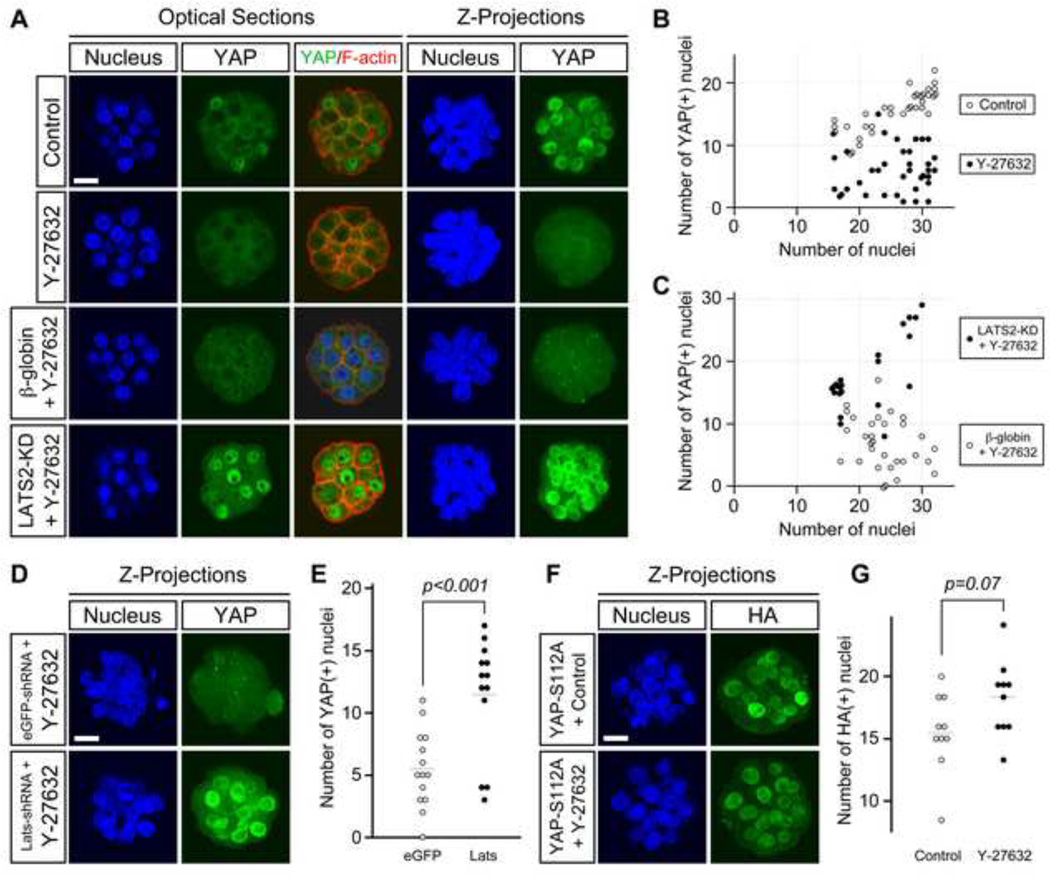
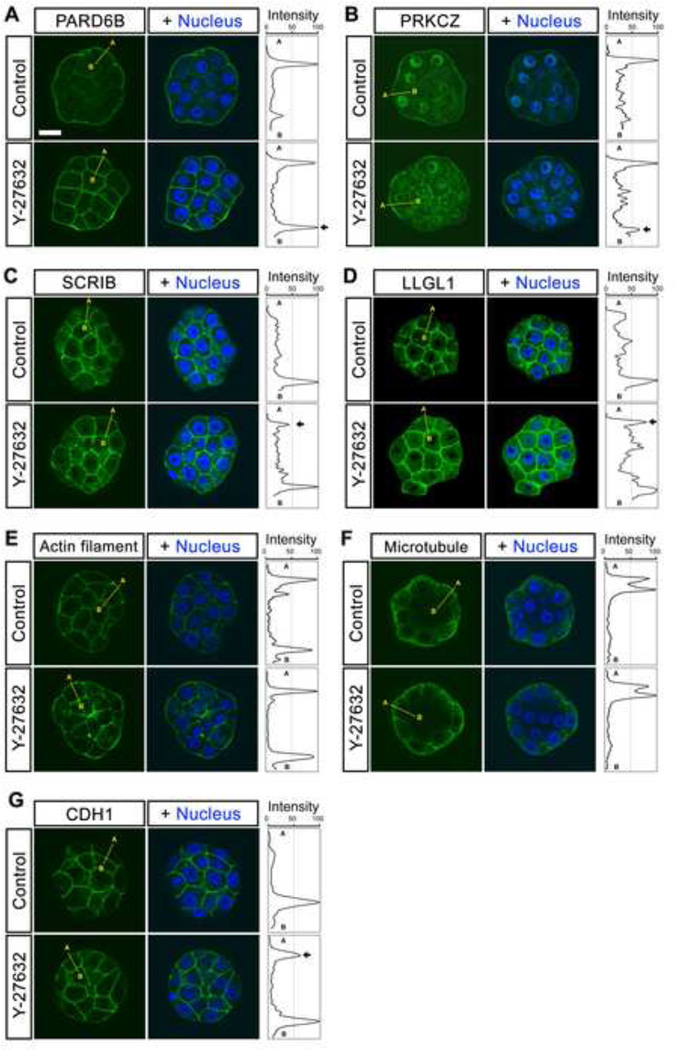
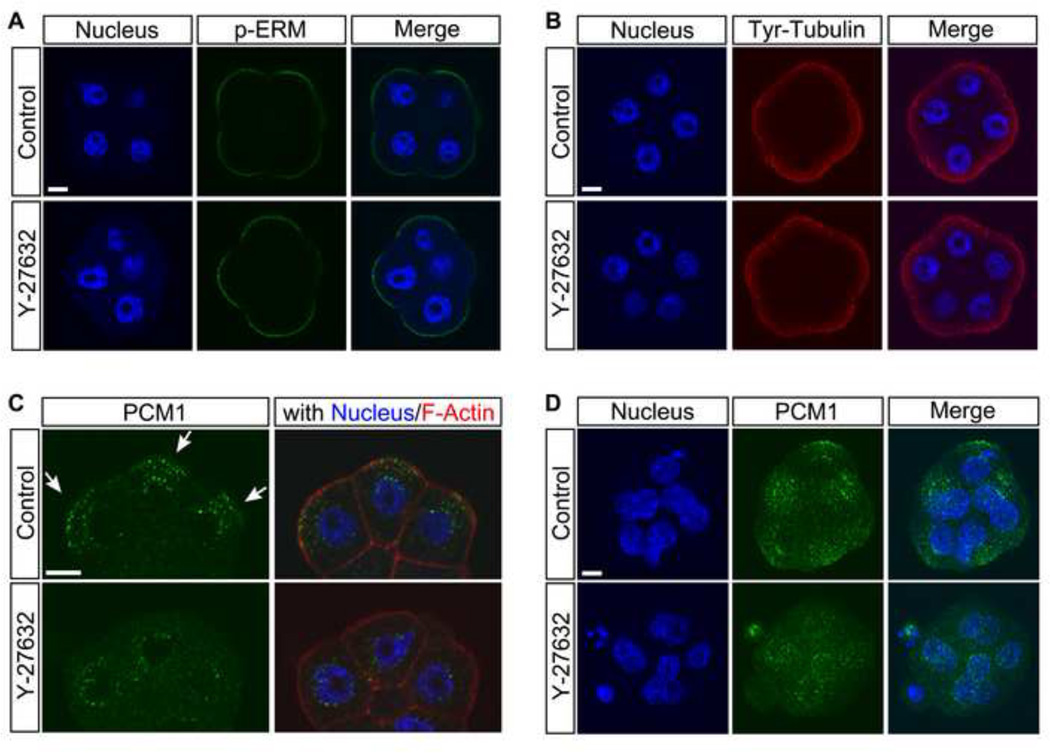
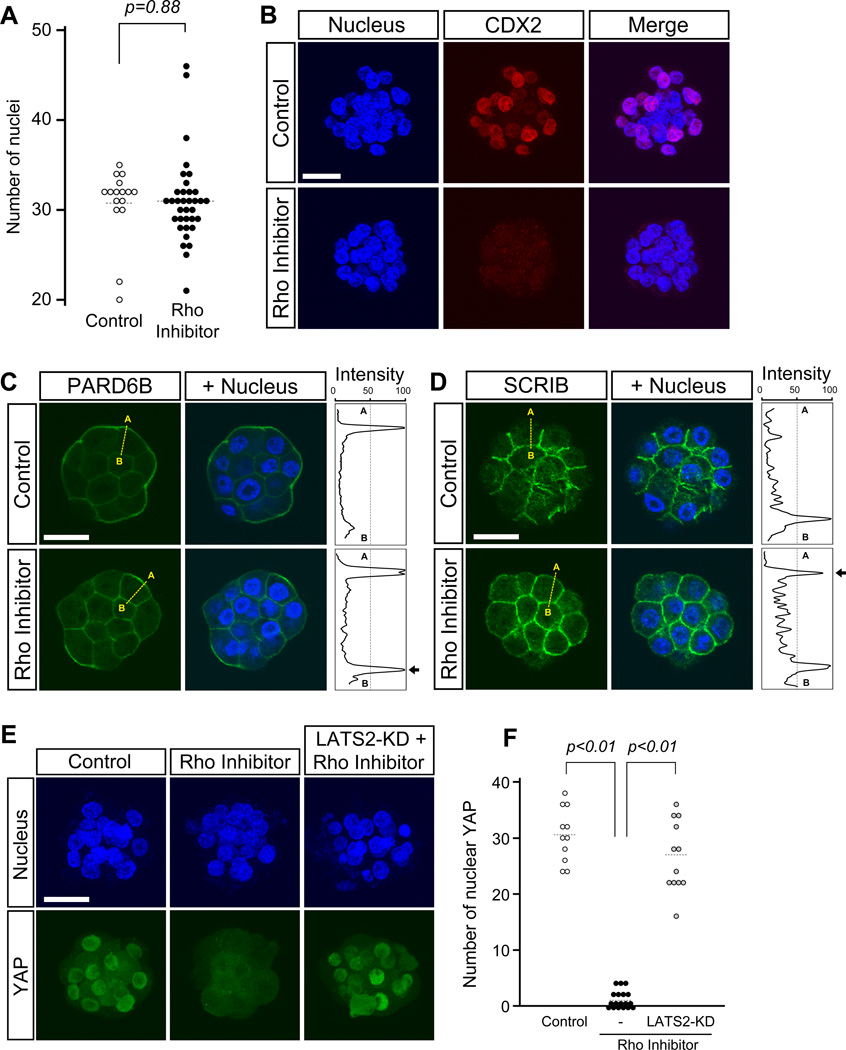
Specification of the trophectoderm (TE) and inner cell mass (ICM) lineages in the mouse blastocyst correlates with cell position, as TE derives from outer cells whereas ICM from inner cells. Differences in position are reflected by cell polarization and Hippo signaling. Only in outer cells, the apical-basal cell polarity is established, and Hippo signaling is inhibited in such a manner that LATS1 and 2 (LATS1/2) kinases are prevented from phosphorylating YAP, a key transcriptional co-activator of the TE-specifying gene Cdx2. However, the molecular mechanisms that regulate these events are not fully understood. Here, we showed that inhibition of RHO-ROCK signaling enhances ICM and suppresses TE characteristics through activation of Hippo signaling and disruption of apical-basal polarity. Embryos treated with ROCK inhibitor Y-27632 exhibited elevated expression of ICM marker NANOG and reduced expression of CDX2 at the blastocyst stage. Y-27632-treated embryos failed to accumulate YAP in the nucleus, although it was rescued by concomitant inhibition of LATS1/2. Segregation between apical and basal polarity regulators, namely PARD6B, PRKCZ, SCRIB, and LLGL1, was dampened by Y-27632 treatment, whereas some of the polarization events at the late 8-cell stage such as compaction and apical localization of p-ERM and tyrosinated tubulin occurred normally. Similar abnormalities of Hippo signaling and apical-basal polarization were also observed in embryos that were treated with RHO GTPases inhibitor. These results suggest that RHO-ROCK signaling plays an essential role in regulating Hippo signaling and cell polarization to enable proper specification of the ICM and TE lineages.

Keywords: CDX2; Cell lineage; Cell polarity; Inner cell mass; Trophectoderm; YAP.


Figures

Fig. 1
Fig. 1
Inhibition of ROCK activity interferes with blastocyst cavity formation. Embryos were cultured in the absence (control) or presence of Y-27632 from 2-cell to blastocyst stage (E1.5–E4.5). (A) Development was recorded by time-lapse cinematography. Snap-shot images of control and inhibitor-treated embryos correspond to developmental stages (from left to right) 8-cell (uncompacted and compacted), morula and early cavitating (E3.5), and late blastocyst with expanded cavity (E4.5). h, hours post-hCG injection. (B) Comparison of total cell numbers. Circles represent the number of DAPI-stained nuclei in individual embryos, and horizontal dashed bars represent the mean value for each group. There is no statistically significant difference (Student t-test) between control (n=9) and inhibitor-treated (n=16) embryos. (C) Presence of maternal mRNA for Rock1 and Rock2 in the oocyte, as determined by RT-PCR. Lanes 1 and 8 are DNA size marker (100bp ladder). Lanes 2, 3, and 4 are PCR products of the Rock1 primers (N, M, and C, respectively). Lanes 5, 6, and 7 are PCR products of the Rock2 primers (N, M, and C, respectively). (D) Disruption of tight junctions by ROCK inhibition. Representative embryos (E4.5) immunostained for TJP1 (green) are shown. In the control embryo, TJP1 appears as a continuous line in sites of cell-cell contact between outer cells, whereas in the treated embryo, TJP1 appears discontinuous or absent, and thick rings (arrowheads) of TJP1 are sometimes observed. Images are Z-axis projections of optical sections captured by confocal microscopy. Blue, DAPI. Scale bars: (A) 50 µm, (D) 20 µm.
Fig. 2
Fig. 2
Inhibition of ROCK activity promotes ICM and diminishes TE gene expressions. Embryos were cultured in the absence (control) or presence of Y-27632 from 2-cell to blastocyst stage (E1.5-E4.5). (A) Distribution of the TE lineage marker, CDX2 (red), in representative control and treated embryos (E4.5). (B) Comparison of the number of CDX2-positive cells. Inhibitor-treated embryos (n=16) have significantly less CDX2-expressing cells (Student t-test) than control embryos (n=9). Circles represent the number of CDX2-positive cells in individual embryos, and horizontal dashed bars represent the mean value for each group. (C) Distribution of the pluripotency marker, NANOG (green), in representative control and treated embryos (E4.5). (D) Comparison of the number of NANOG-positive cells. Inhibitor-treated embryos (n=10) have significantly more NANOG-expressing cells (Student t-test) than control embryos (n=7). Circles represent the number of NANOG-positive cells in individual embryos, and horizontal dashed bars represent the mean value for each group. Images (A, C) are Z-axis projections of optical sections captured by confocal microscopy. Blue, DAPI. Scale bars: 20 µm. (E) Quantitative RT-PCR analyses of Y-27632-treated embryos at the early blastocyst stage (100 h post-hCG). Relative expression levels of Tead4, Cdx2, Gata3, Pou5f1, Nanog, and Sox2 are shown as percentages of their levels in the inhibitor-treated embryos relative to those in control embryos. In each set of experiments, the expression level of each gene is normalized by that of Actb. Bars indicate mean ± standard deviation. P values for Cdx2, Gata3, Nanog, and Sox2 are based on Student t-test, indicating that the change in these genes by Y-27632 treatment is statistically significant.
Fig. 3
Fig. 3
ROCK activity is essential for nuclear localization of YAP through interference with its phosphorylation by LATS1/2. (A) Embryos were cultured in the absence or presence of Y-27632 from 2- to 32-cell stage (E1.5-E3.5). Nuclear YAP (green) diminishes in the outer cells of inhibitor-treated embryos. Overexpression of dominant-negative LATS (LATS2-KD) rescues nuclear localization of YAP in treated embryos, whereas overexpression of β-globin does not. Cell boundaries are demarcated by F-actin (red) staining. (B) The numbers of total nuclei and YAP-positive nuclei in untreated (control) and inhibitor-treated embryos. (C) The numbers of total nuclei and YAP-positive nuclei in inhibitor-treated embryos that have been overexpressed with LATS2-KD and β-globin. (B–C) Circles correspond to individual embryos, which are presented in the graphs according to the total number of nuclei (x-axis) and the number of YAP-positive nuclei (y-axis). (D) Distribution of nuclear YAP (green) in treated embryos that have been injected with Egfp shRNA plasmid or a mixture of Lats1-specific and Lats2-specific shRNA plasmids. Lats1/Lats2 knockdown rescues nuclear accumulation of YAP. (E) Comparison of the number of YAP-positive nuclei. Inhibitor-treated embryos injected with Lats1/Lats2 shRNA plasmids (n=13) have significantly more YAP-positive nuclei (Student t-test) than inhibitor-treated embryos injected with Egfp shRNA plasmid (n=14). Circles represent the number of YAP-positive nuclei in individual embryos, and horizontal dashed bars represent the mean value for each group. (F) Distribution of phosphorylation-defective YAP (YAP-S112A) tagged with HA epitope (green) in untreated and inhibitor-treated embryos. Nuclear localization of YAP-S112A occurs in both treated and control embryos. (G) Comparison of the number of nuclear YAP-S112A. There is no statistically significant difference (Student t-test) between control (n=10) and inhibitor-treated (n=10) embryos. Circles represent the number of HA-positive nuclei in individual embryos, and horizontal dashed bars represent the mean value for each group. Images (A, D, F) were captured by confocal microscopy. Blue, DAPI. Scale bars: 20 µm.
Fig. 4
Fig. 4
Localization of polarity proteins in ROCK inhibitor-treated embryos. Embryos were cultured in the absence or presence of Y-27632 from 2- to 32-cell stage (E1.5–E3.5). (A–B) Immunostaining for PARD6B (green in A) and PRKCZ (green in B) shows strong apical membrane-enrichment in the outer cells of control embryos. With Y-27632 treatment, PARD6B and PRKCZ show membrane-enrichment extending to the basolateral region. (C–D) Immunostaining for SCRIB (green in C) and LLGL1 (green in D) shows distinct basolateral membrane-enrichment in the outer cells of control embryos. With Y-27632 treatment, SCRIB and LLGL1 show membrane-enrichment extending to the apical region. (E–F) Staining for actin filaments (green in E) and microtubules (green in F) shows no evident difference between control and Y-27632 treatment. (G) Immunostaining for CDH1 (E-cadherin) shows distinct basolateral membrane-localization in most of the control embryos. With Y-27632 treatment, a significantly higher number of embryos exhibited apical staining of CDH1. Images are optical sections captured by confocal microscopy. Blue, DAPI. Abbreviations: A (apical), B (basal). Scale bar (A–G): 20 µm.
Fig. 5
Fig. 5
ROCK inhibition does not interfere with all events of cell polarization at the time of compaction of the 8-cell stage embryo. Embryos were cultured in the absence or presence of Y-27632 from 2- to 8-cell (compacted) stage (E1.5–E2.5). (A–B) Immunostaining for p-ERM (green in A) and tyrosinated tubulin (red in B) shows retention of strong localization in the apical domain in inhibitor-treated embryos that is similar to that in control embryos. (C) Immunostaining for PCM1 (green) shows puncta (arrows) clustered between the apical domain and nucleus in the control embryo. With ROCK inhibition, the apical clustering is lost. Cell boundaries are demarcated by staining for F-actin (red). Images (A–C) are optical sections captured by confocal microscopy. (D) Projections of optical sections in the Z-axis of the embryo immunostained for PCM1 (green). Blue, DAPI. Scale bars: 10 µm.
Fig. 6
Fig. 6
RHO inhibition phenocopies the Y-27632-induced disruption of cell polarity and activation of Hippo signaling in embryos. Embryos were cultured in the absence or presence of RHO Inhibitor I from 8- to 32-cell stage (E2.5–E3.5). (A) Comparison of total nuclear numbers. There is no statistically significant difference (Student t-test) between control (n=16) and inhibitor-treated (n=35) embryos. Circles represent the number of DAPI-stained nuclei in individual embryos, and horizontal dashed bars represent the mean value for each group. (B) Immunostaining for the TE lineage marker, CDX2 (red), in representative embryos. CDX2 is diminished in the inhibitor-treated embryo. Images are Z-axis projections of optical sections. (C-D) Immunostaining for apical-basal polarity proteins in representative embryos. In the control embryo, PARD6B (green in C) is strongly enriched in the apical domains and weakly enriched in the basolateral domains of outer cells. With inhibitor treatment, PARD6B localization becomes more distinct in the basolateral region. On the other hand, SCRIB (green in D) is enriched in the basolateral domains of outer cells in the control embryo, but also becomes localized in the apical domains in the treated embryo. Images are optical sections. Abbreviations: A (apical), B (basal). (E) Nuclear YAP (green) diminishes in the inhibitor-treated embryo. Overexpression of dominant-negative LATS (LATS2-KD) rescues nuclear localization of YAP in the inhibitor-treated embryo. Images are Z-axis projections of optical sections. (F) Comparison of the number of YAP-positive nuclei. Nuclear localization of YAP is significantly reduced in RHO inhibitor-treated embryos (n=18) compared to untreated control embryos (n=11; Student t-test). Nuclear localization of YAP is restored in inhibitor-treated embryos that have been overexpressed with LATS-KD (n=12; Student t-test). Circles represent the number of YAP-positive nuclei in individual embryos, and horizontal dashed bars represent the mean value for each group. Blue, DAPI. Scale bars: 20 µm.

Similar articles

Cited by

References

    1. Aktories K, Hall A. Botulinum ADP-ribosyltransferase C3: a new tool to study low molecular weight GTP-binding proteins. Trends Pharmacol. Sci. 1989;10:415–418. - PubMed
    1. Alarcon VB. Cell polarity regulator PARD6B is essential for trophectoderm formation in the preimplantation mouse embryo. Biol. Reprod. 2010;83:347–358. - PMC - PubMed
    1. Amano M, Nakayama M, Kaibuchi K. Rho-kinase/ROCK: A key regulator of the cytoskeleton and cell polarity. Cytoskeleton. 2010;67:545–554. - PMC - PubMed
    1. Amin E, Dubey BN, Zhang SC, Gremer L, Dvorsky R, Moll JM, Taha MS, Nagel-Steger L, Piekorz RP, Somlyo AV, Ahmadian MR. Rho-kinase: regulation, (dys)function, and inhibition. Biol. Chem. 2013;394:1399–1410. - PMC - PubMed
    1. Avruch J, Zhou D, Fitamant J, Bardeesy N, Mou F, Barrufet LR. Protein kinases of the Hippo pathway: regulation and substrates. Semin. Cell Dev. Biol. 2012;23:770–784. - PMC - PubMed

Publication types

MeSH terms

Substances