. 2014 Dec 1:563:79-93.
doi: 10.1016/j.abb.2014.06.030. Epub 2014 Jul 2.

The role of melanogenesis in regulation of melanoma behavior: melanogenesis leads to stimulation of HIF-1α expression and HIF-dependent attendant pathways

Affiliations

The role of melanogenesis in regulation of melanoma behavior: melanogenesis leads to stimulation of HIF-1α expression and HIF-dependent attendant pathways

A Slominski et al. Arch Biochem Biophys. .

Abstract

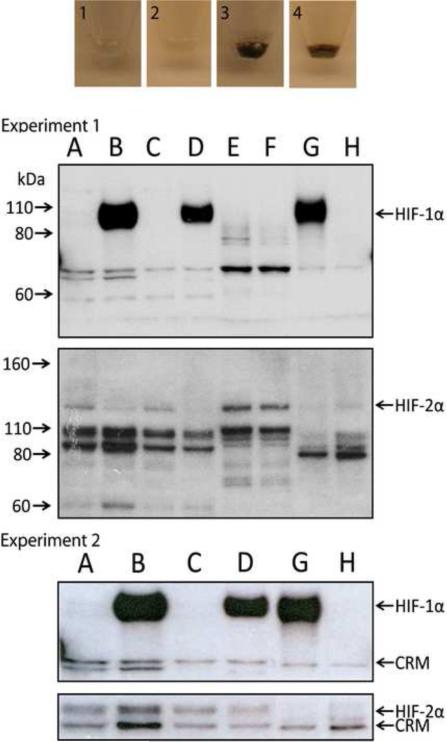
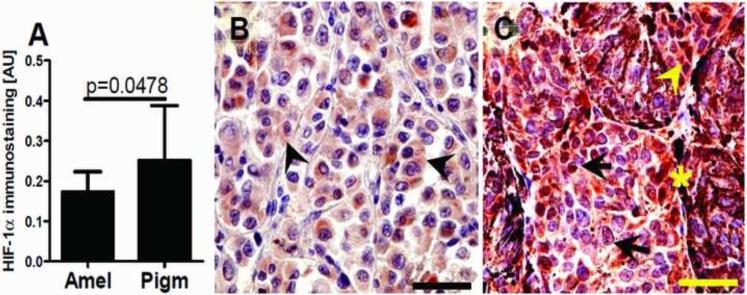
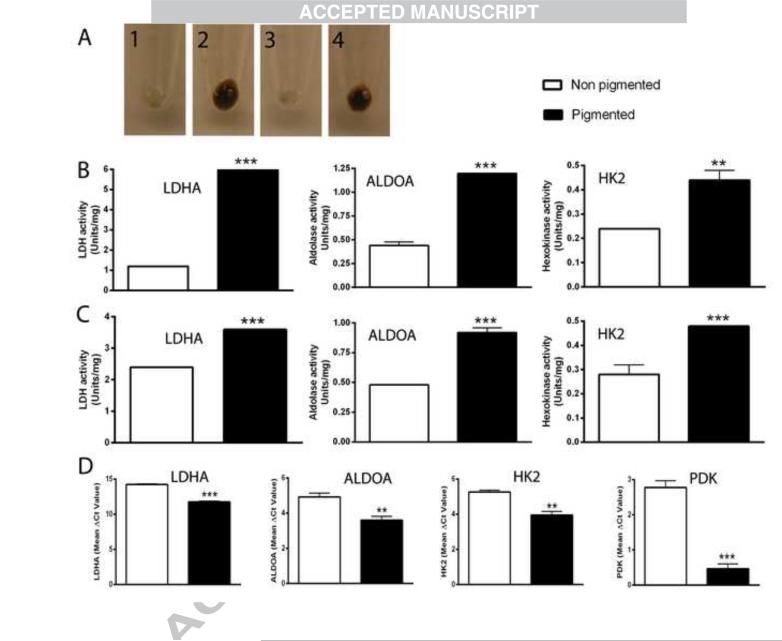
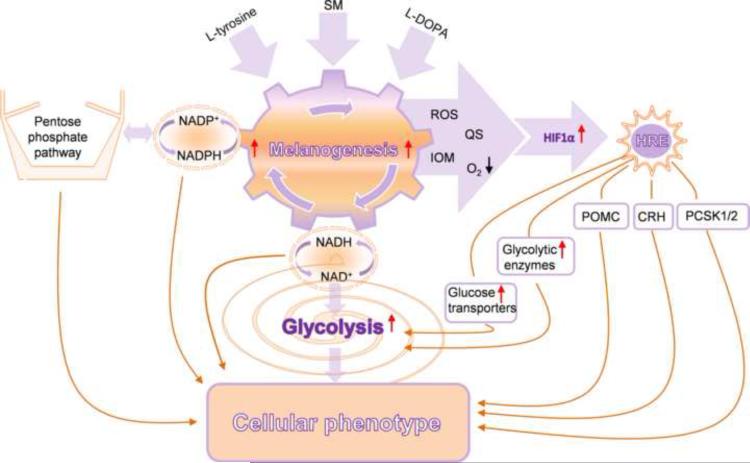
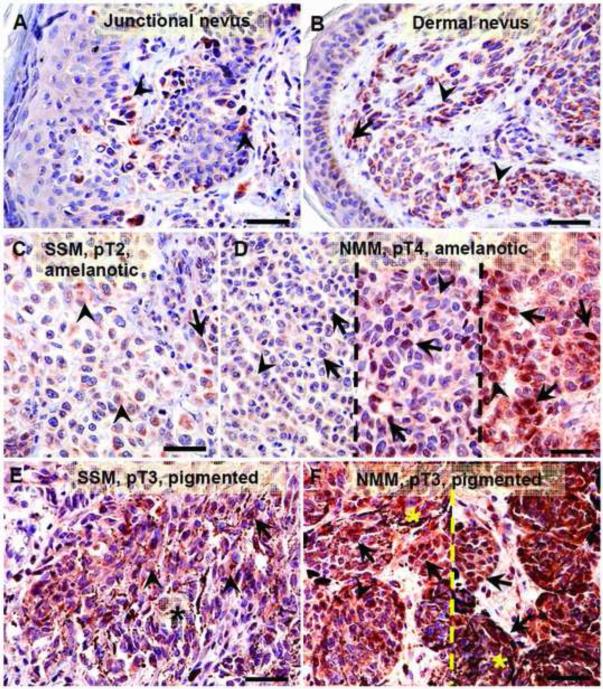
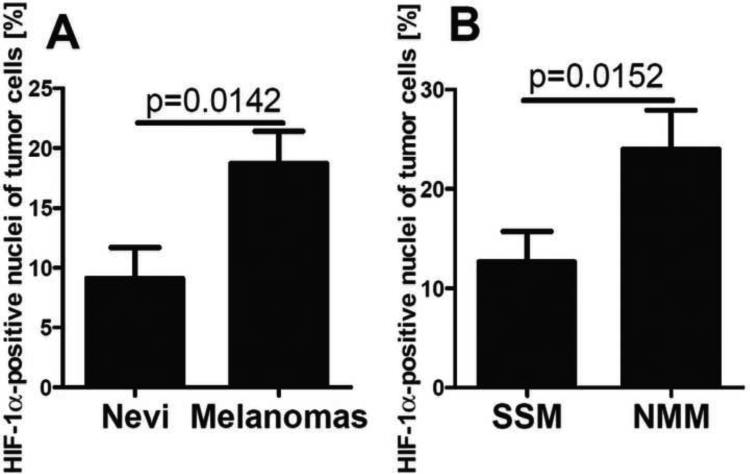
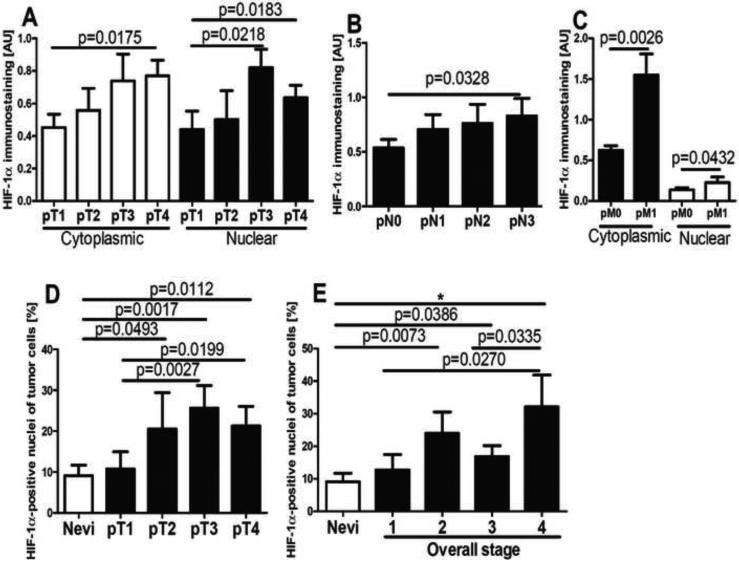
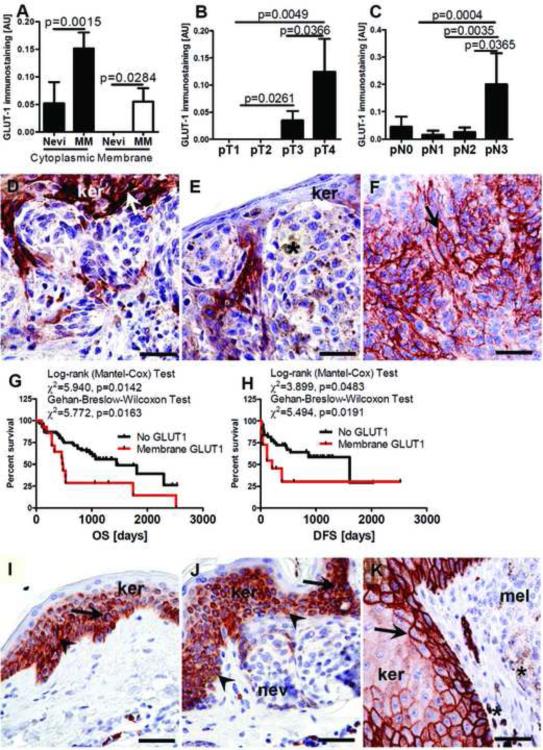
To study the effect of melanogenesis on HIF-1α expression and attendant pathways, we used stable human and hamster melanoma cell lines in which the amelanotic vs. melanotic phenotypes are dependent upon the concentration of melanogenesis precursors in the culture media. The induction of melanin pigmentation led to significant up-regulation of HIF-1α, but not HIF-2α, protein in melanized cells for both lines. Similar upregulation of nuclear HIF-1α was observed in excisions of advanced melanotic vs. amelanotic melanomas. In cultured cells, melanogenesis also significantly stimulated expression of classical HIF-1-dependent target genes involved in angiogenesis and cellular metabolism, including glucose metabolism and stimulation of activity of key enzymes in the glycolytic pathway. Several other stress related genes containing putative HRE consensus sites were also upregulated by melanogenesis, concurrently with modulation of expression of HIF-1-independent genes encoding for steroidogenic enzymes, cytokines and growth factors. Immunohistochemical studies using a large panel of pigmented lesions revealed that higher levels of HIF-1α and GLUT-1 were detected in advanced melanomas in comparison to melanocytic nevi or thin melanomas localized to the skin. However, the effects on overall or disease free survival in melanoma patients were modest or absent for GLUT-1 or for HIF-1α, respectively. In conclusion, induction of the melanogenic pathway leads to robust upregulation of HIF-1-dependent and independent pathways in cultured melanoma cells, suggesting a key role for melanogenesis in regulation of cellular metabolism.

Keywords: Glycolysis; HIF-1; Melanogenesis; Melanoma; Melanoma progression; Metabolism.


Figures

Figure 1
Figure 1
The induction of melanin pigmentation is associated with up-regulation of HIF-1α, but not HIF-2α protein. For each independent experiment, experiment 1 (upper panels) and experiment 2 (lower panels), respectively, images of cell pellets obtained from two stable melanoma cell lines [Bomirski hamster AbC1 (1, 3) and human SKMEL-188 (2, 4)] that were cultured as described in the Materials and Methods and western blots for HIF-1α and HIF-2α are shown. For the western blots, lanes correspond to the following HS-WCE: A and C: amelanotic (non-pigmented) AbC1 and SKMEL-188 cells, respectively; B and D: melanotic (pigmented) AbC1 and SK-MEL 188 cells, respectively; E, Caki cells cultured 6h at hypoxia; F, Caki cells cultured at normoxia; G and H, HIF-1 WT (G) and HIF-1 KO (H) PyMT MTECs cultured at hypoxia (6h at 0.5% O2). Arrows to the left indicate the molecular weight (MW, kDa), whereas arrows to the right point to either HIF-1α, HIF-2α or cross-reactive material (CRM).
Figure 2
Figure 2
Relationship between maximal HIF-1α expression and melanin production (A). Statistically significant differences are denoted using p values as determined by Student's t-test. Amel: amelanotic melanomas, Pigm: pigmented melanomas. Representative immunostaining in amelanotic (B) and pigmented (C) melanomas. Arrows show nuclear HIF-1α immunostaining, whereas arrowheads show cytoplasmic HIF-1α immunostaining, asterisks indicate melanin; scale bar: 50 μm.
Figure 3
Figure 3
Melanogenesis induces gene expression associated with increased HIF-1α expression. SKMEL-188 cells were grown in Ham's F10 containing 5% FBS, followed by incubation in fresh Ham's F10 containing 5% FBS for non-pigmentation or 75% DMEM and 25% Ham's F10 containing 5% FBS for pigmentation. The cells were harvested after 2 days (B) or 3 days (C) for enzyme assays and after 2 days for qPCR (D). A-1, non-pigmented cells at day 2; A-2, pigmented cells at day 2; A-3, non-pigmented cells at day 3; A-4, pigmented cells at day 3. Panels B and C summarize the enzyme activities as determined using whole cell protein extracts as described in the methods. Panel D shows the mean values of ΔCp for each gene (with lower values indicative or relatively higher gene expression levels). Data are presented as the mean ± SE (n = 3). **p < 0.01; ***p < 0.001 by Student's t-test.
Figure 4
Figure 4
The proposed interactions between melanogenesis, glucose metabolism and potential HIF-1 dependent genes/pathways that culminate to regulate cellular metabolism. SM: stimulators of melanogenesis, ROS: reactive oxygen species, QS: quinones and semiquinones, IOM: intermediates of melanogenesis, POMC: proopiomelanocortin, CRH: corticotropin releasing hormone, PCSK1/2: proprotein convertase subtilisin/kexin types 1 and 2.
Figure 5
Figure 5
Representative immunostaining with antibodies against HIF-1α in nevi (A, B) and melanomas (C-F). Dashed lines separates cases with these same pathomorphological features, arrows show nuclear HIF-1α immunostaining, arrow-head shows cytoplasmic HIF-1α immunostaining, asterisks indicates melanin; scale bar 50 μm.
Figure 6
Figure 6
Differences in HIF-1α immunostaining between nevi (n=26) and melanomas (n=75) (A) and between superficial spreading (SSM) (n=36) or nodular (NMM) (n=37) melanomas (B). Statistically significant differences are denoted with p values as determined by Student's t-test.
Figure 7
Figure 7
Expression of cytoplasmic (A,B,C) and nuclear (A,C) HIF-1α antigen in melanomas stratified according pT (A), pN (B) and pM (C) stage. The percentage of HIF-1α-positive tumor cell nuclei in nevi and melanomas stratified according pT (D) and overall stage (E). Statistically significant differences are denoted with p values determined by Student's t-test and with asterisks by ANOVA (*p <0.05). Refer to Table 1 for information regarding the number of cases per melanoma stage.
Figure 8
Figure 8
GLUT-1 expression in nevi and melanomas (A), membrane GLUT-1 expression and melanoma stratified according pT (B) and pN (C) classification. Representative GLUT-1 immunostaining in pT1 (D), pT2 (E) and pT4 (F) melanomas. Relationship between OS (G) or DFS (H) and membrane GLUT-1 levels. Representative immunostaining of GLUT-1 in normal skin (I), in the epidermis above the nevus (J) or in melanoma (K). Statistically significant differences are denoted with p values as determined by Student's t-test. Arrows show membrane GLUT-1 immunostaining, whereas arrowheads indicate cytoplasmic GLUT-1 immunostaining, and asterisks indicate melanin, MM: melanomas, ker: keratinocytes, nev: nevus cells, mel: melanoma cells; scale bar 50 μm. Refer to Table 2 for information regarding the number of cases per melanoma stage.

Similar articles

Cited by

References

    1. Levine D, Fisher DE. Methods Mol Biol. 2014;1102:177–197. - PubMed
    1. Schadendorf D, Hauschild A. Nat Rev Clin Oncol. 2014 - PubMed
    1. Kwong LN, Davies MA. Oncogene. 2014;33:1–9. - PubMed
    1. Hanahan D, Weinberg RA. Cell. 2011;144:646–674. - PubMed
    1. Robert C, Dummer R, Gutzmer R, Lorigan P, Kim KB, Nyakas M, Arance A, Liszkay G, Schadendorf D, Cantarini M, Spencer S, Middleton MR. Lancet Oncol. 2013;14:733–740. - PubMed

Publication types

MeSH terms

Substances