Computational analysis of image-based drug profiling predicts synergistic drug combinations: applications in triple-negative breast cancer
- PMID: 24997502
- PMCID: PMC4253311
- DOI: 10.1016/j.molonc.2014.06.007
Computational analysis of image-based drug profiling predicts synergistic drug combinations: applications in triple-negative breast cancer
Abstract
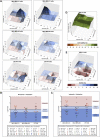
An imaged-based profiling and analysis system was developed to predict clinically effective synergistic drug combinations that could accelerate the identification of effective multi-drug therapies for the treatment of triple-negative breast cancer and other challenging malignancies. The identification of effective drug combinations for the treatment of triple-negative breast cancer (TNBC) was achieved by integrating high-content screening, computational analysis, and experimental biology. The approach was based on altered cellular phenotypes induced by 55 FDA-approved drugs and biologically active compounds, acquired using fluorescence microscopy and retained in multivariate compound profiles. Dissimilarities between compound profiles guided the identification of 5 combinations, which were assessed for qualitative interaction on TNBC cell growth. The combination of the microtubule-targeting drug vinblastine with KSP/Eg5 motor protein inhibitors monastrol or ispinesib showed potent synergism in 3 independent TNBC cell lines, which was not substantiated in normal fibroblasts. The synergistic interaction was mediated by an increase in mitotic arrest with cells demonstrating typical ispinesib-induced monopolar mitotic spindles, which translated into enhanced apoptosis induction. The antitumour activity of the combination vinblastine/ispinesib was confirmed in an orthotopic mouse model of TNBC. Compared to single drug treatment, combination treatment significantly reduced tumour growth without causing increased toxicity. Image-based profiling and analysis led to the rapid discovery of a drug combination effective against TNBC in vitro and in vivo, and has the potential to lead to the development of new therapeutic options in other hard-to-treat cancers.
Keywords: Compound profiling; High-content screening; KSP/Eg5 inhibitors; Microtubule-targeting agents; Synergy; Triple-negative breast cancer.
Copyright © 2014 Federation of European Biochemical Societies. Published by Elsevier B.V. All rights reserved.
Figures


Similar articles
-
Histone Deacetylase Inhibitor Enhances the Efficacy of MEK Inhibitor through NOXA-Mediated MCL1 Degradation in Triple-Negative and Inflammatory Breast Cancer.Clin Cancer Res. 2017 Aug 15;23(16):4780-4792. doi: 10.1158/1078-0432.CCR-16-2622. Epub 2017 May 2. Clin Cancer Res. 2017. PMID: 28465444 Free PMC article.
-
Activity of the kinesin spindle protein inhibitor ispinesib (SB-715992) in models of breast cancer.Clin Cancer Res. 2010 Jan 15;16(2):566-76. doi: 10.1158/1078-0432.CCR-09-1498. Epub 2010 Jan 12. Clin Cancer Res. 2010. PMID: 20068098 Free PMC article.
-
Targeting EGFR of triple-negative breast cancer enhances the therapeutic efficacy of paclitaxel- and cetuximab-conjugated nanodiamond nanocomposite.Acta Biomater. 2019 Mar 1;86:395-405. doi: 10.1016/j.actbio.2019.01.025. Epub 2019 Jan 16. Acta Biomater. 2019. PMID: 30660004
-
Progress on kinesin spindle protein inhibitors as anti-cancer agents.Anticancer Agents Med Chem. 2008 Aug;8(6):698-704. Anticancer Agents Med Chem. 2008. PMID: 18690830 Review.
-
Role of KSP Inhibitors as Anti-cancer Therapeutics: An Update.Anticancer Agents Med Chem. 2022;22(14):2517-2538. doi: 10.2174/1871520622666220119093105. Anticancer Agents Med Chem. 2022. PMID: 35043768 Review.
Cited by
-
Pharmacologic profiling of patient-derived xenograft models of primary treatment-naïve triple-negative breast cancer.Sci Rep. 2020 Oct 21;10(1):17899. doi: 10.1038/s41598-020-74882-4. Sci Rep. 2020. PMID: 33087803 Free PMC article.
-
Therapeutic strategies to induce ERα in luminal breast cancer to enhance tamoxifen efficacy.Endocr Relat Cancer. 2019 Aug;26(8):689-698. doi: 10.1530/ERC-19-0042. Endocr Relat Cancer. 2019. PMID: 31167163 Free PMC article.
-
Silibinin, Synergistically Enhances Vinblastine-Mediated Apoptosis in Triple Negative Breast Cancer Cell Line: Involvement of Bcl2/Bax and Caspase-3 Pathway.Int J Hematol Oncol Stem Cell Res. 2024 Apr 1;18(2):174-182. doi: 10.18502/ijhoscr.v18i2.15375. Int J Hematol Oncol Stem Cell Res. 2024. PMID: 38868811 Free PMC article.
-
Synergistic Cytotoxicity of Renieramycin M and Doxorubicin in MCF-7 Breast Cancer Cells.Mar Drugs. 2019 Sep 16;17(9):536. doi: 10.3390/md17090536. Mar Drugs. 2019. PMID: 31527453 Free PMC article.
-
A new paradigm for drug discovery in the treatment of complex diseases: drug discovery and optimization.Chin Med. 2025 Mar 24;20(1):40. doi: 10.1186/s13020-025-01075-4. Chin Med. 2025. PMID: 40122800 Free PMC article. Review.
References
-
- Baguley, B.C. , Kerr, D.J. , 2002. Anticancer Drug Development Academic Press; San Diego:
-
- Bonadonna, G. , Zucali, R. , Monfardini, S. , De Lena, M. , Uslenghi, C. , 1975. Combination chemotherapy of Hodgkin's disease with adriamycin, bleomycin, vinblastine, and imidazole carboxamide versus MOPP. Cancer 36, 252–259. - PubMed
-
- Carey, L.A. , Dees, E.C. , Sawyer, L. , Gatti, L. , Moore, D.T. , Collichio, F. , Ollila, D.W. , Sartor, C.I. , Graham, M.L. , Perou, C.M. , 2007. The triple negative paradox: primary tumor chemosensitivity of breast cancer subtypes. Clin. Cancer Res. – Off. J. Am. Assoc. Cancer Res. 13, 2329–2334. - PubMed
Publication types
MeSH terms
Substances
Grants and funding
LinkOut - more resources
Full Text Sources
Other Literature Sources

