

Vitamin D and melatonin protect the cell's viability and ameliorate the CCl4 induced cytotoxicity in HepG2 and Hep3B hepatoma cell lines
- PMID: 24997582
- PMCID: PMC4628931
- DOI: 10.1007/s10616-014-9738-8
Vitamin D and melatonin protect the cell's viability and ameliorate the CCl4 induced cytotoxicity in HepG2 and Hep3B hepatoma cell lines
Abstract
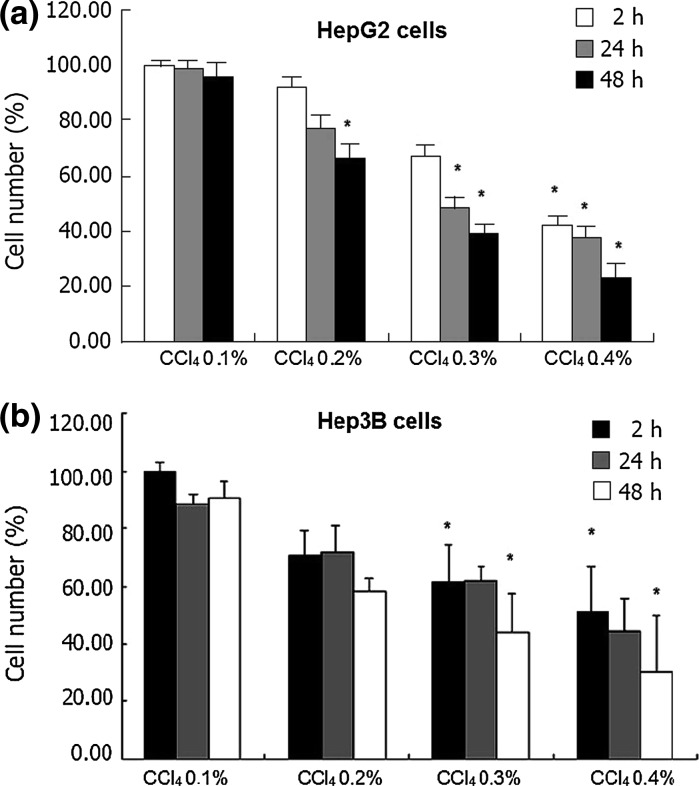
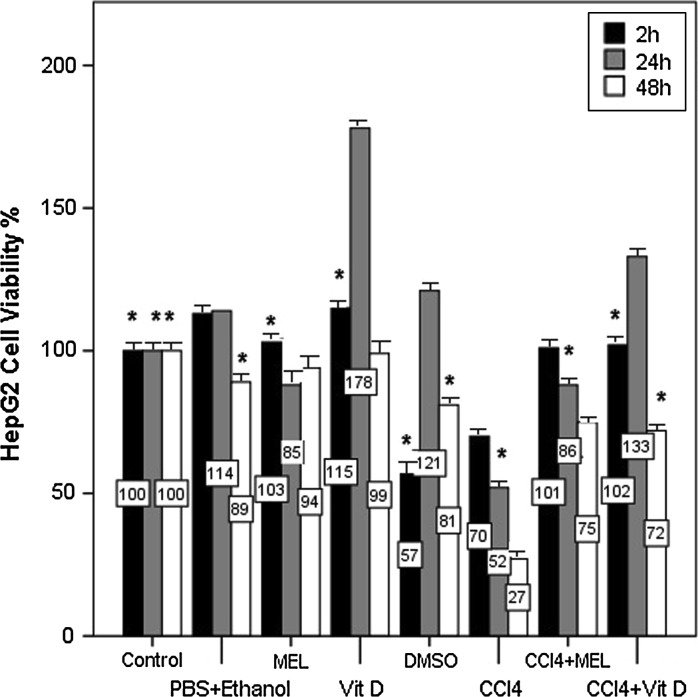
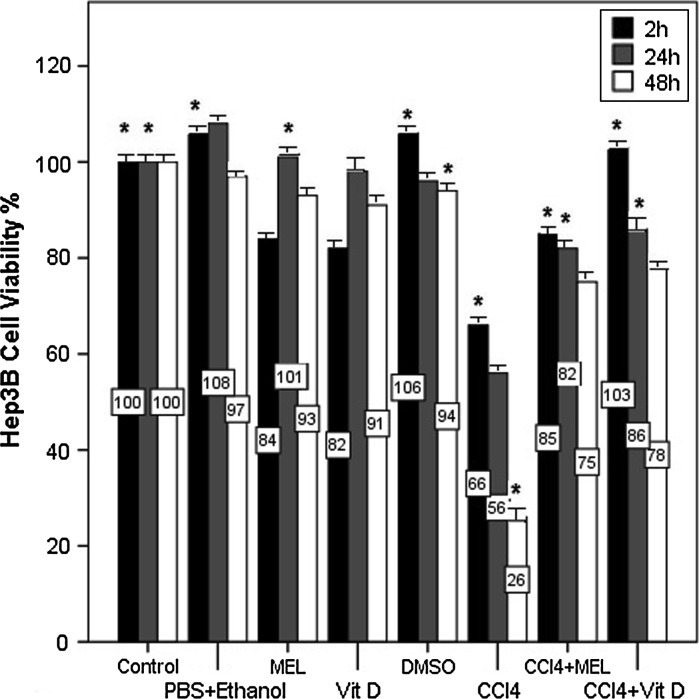
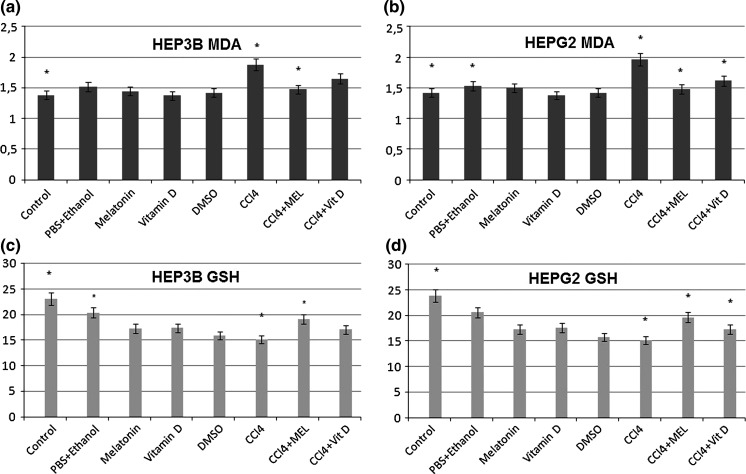
Carbon tetrachloride (CCl4) is widely used to induce liver toxicity in in vitro/in vivo models. Lipid peroxidation (LPO) begins with toxicity and affects cell viability. Recently, the beneficial effects of melatonin and Vitamin D on cell proliferation in human normal and cancer cells were found. This study was planned to evaluate antioxidant and cytoprotective activity of melatonin and Vitamin D in CCl4 induced cytotoxicity in HepG2 and Hep3B hepatoma cell lines. Based on the cytotoxicity assay, melatonin and Vitamin D were evaluated for cytotoprotective potential against CCl4 induced toxicity in HepG2 and Hep3B liver cell lines by monitoring cell viability, LPO and glutathione (GSH) level. Different dosages of CCl4 (0.1, 0.2, 0.3 and 0.4 % v/v) were applied to HepG2 and Hep3B cells in order to determine the most toxic dosage of it in a time dependent manner. The same experiments were repeated with exogenously applied melatonin (MEL) and Vitamin D to groups treated with/without CCL4. Cell viability was determined with MTT measurements at the 2nd, 24th and 48th h. GSH content and Malondialdehyde levels were measured from the cell lysates. As a result, both melatonin and Vitamin D administration during CCl4 exposure protected liver cells from CCl4 induced cell damage. Increase in LPO and decrease in GSH were found in the CCl4 groups of both cells. Contrary to these results administration of MEL and Vitamin D on cells exhibited results similar to the control groups. Therefore, melatonin and Vitamin D might be a promising therapeutic agent in several toxic hepatic diseases.
Keywords: CCl4; Cell proliferation; Hep3B; HepG2; Liver cytotoxicity; Melatonin; Vitamin D.
Figures
Similar articles
-
Antioxidant and hepatoprotective activity of Fagonia schweinfurthii (Hadidi) Hadidi extract in carbon tetrachloride induced hepatotoxicity in HepG2 cell line and rats.J Ethnopharmacol. 2013 Dec 12;150(3):973-81. doi: 10.1016/j.jep.2013.09.048. Epub 2013 Oct 17. J Ethnopharmacol. 2013. PMID: 24140589
-
Melatonin ameliorates experimental hepatic fibrosis induced by carbon tetrachloride in rats.World J Gastroenterol. 2009 Mar 28;15(12):1452-8. doi: 10.3748/wjg.15.1452. World J Gastroenterol. 2009. PMID: 19322917 Free PMC article.
-
Therapeutic value of melatonin in an experimental model of liver injury and regeneration.J Pineal Res. 2006 Apr;40(3):270-9. doi: 10.1111/j.1600-079X.2005.00310.x. J Pineal Res. 2006. PMID: 16499564
-
Psidium guajava Leaf Extracts and Their Quercetin Protect HepG2 Cell Lines Against CCL4 Induced Cytotoxicity.Indian J Clin Biochem. 2019 Jul;34(3):324-329. doi: 10.1007/s12291-018-0752-z. Epub 2018 Apr 11. Indian J Clin Biochem. 2019. PMID: 31391723 Free PMC article.
-
Melatonin prevents disruption of hepatic reactive oxygen species metabolism in rats treated with carbon tetrachloride.J Pineal Res. 2004 Jan;36(1):10-7. doi: 10.1046/j.1600-079x.2003.00091.x. J Pineal Res. 2004. PMID: 14675125
Cited by
-
Cereblon deficiency ameliorates carbon tetrachloride-induced acute hepatotoxicity in HepG2 cells by suppressing MAPK-mediated apoptosis.Front Immunol. 2024 Jul 30;15:1457636. doi: 10.3389/fimmu.2024.1457636. eCollection 2024. Front Immunol. 2024. PMID: 39139558 Free PMC article.
-
Carbon tetrachloride induced hepato/renal toxicity in experimental mice: antioxidant potential of Egyptian Salvia officinalis L essential oil.Environ Sci Pollut Res Int. 2018 Oct;25(28):27858-27876. doi: 10.1007/s11356-018-2820-6. Epub 2018 Jul 28. Environ Sci Pollut Res Int. 2018. PMID: 30056541
-
Selection of Suitable Reference Genes for qPCR Gene Expression Analysis of HepG2 and L02 in Four Different Liver Cell Injured Models.Biomed Res Int. 2020 Jul 14;2020:8926120. doi: 10.1155/2020/8926120. eCollection 2020. Biomed Res Int. 2020. PMID: 32733961 Free PMC article.
-
Influence of vitamin D treatment on functional expression of drug disposition pathways in human kidney proximal tubule cells during simulated uremia.Xenobiotica. 2021 Jun;51(6):657-667. doi: 10.1080/00498254.2021.1909783. Epub 2021 Apr 18. Xenobiotica. 2021. PMID: 33870862 Free PMC article.
-
Genotoxicity of carbon tetrachloride and the protective role of essential oil of Salvia officinalis L. in mice using chromosomal aberration, micronuclei formation, and comet assay.Environ Sci Pollut Res Int. 2018 Jan;25(2):1621-1636. doi: 10.1007/s11356-017-0601-2. Epub 2017 Nov 3. Environ Sci Pollut Res Int. 2018. PMID: 29098592
References
-
- Abramovitch S, Dahan-Bachar L, Sharvit E, Weisman Y, Ben Tov A, Brazowski E, Reif S. Vitamin D inhibits proliferation and profibrotic marker expression in hepatic stellate cells and decreases thioacetamide-induced liver fibrosis in rats. Gut. 2011;60:1728–1737. doi: 10.1136/gut.2010.234666. - DOI - PubMed
-
- Agency for Toxic Substances and Disease Registry (ATSDR) Toxicological profile for carbon tetrachloride. Atlanta, GA: U.S. Department of Health and Human Services, Public Health Service; 2005. - PubMed
LinkOut - more resources
Full Text Sources
Other Literature Sources
Research Materials
