

Serum cholesterol and variant in cholesterol-related gene CETP predict white matter microstructure
- PMID: 24997672
- PMCID: PMC4198330
- DOI: 10.1016/j.neurobiolaging.2014.05.024
Serum cholesterol and variant in cholesterol-related gene CETP predict white matter microstructure
Abstract
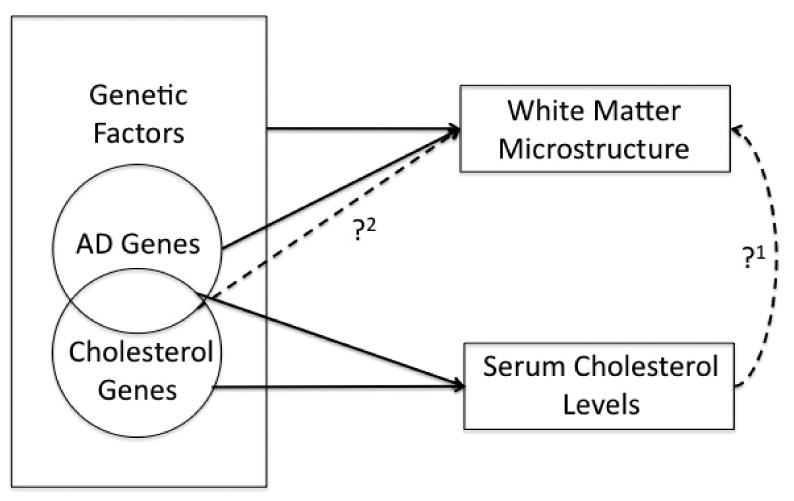
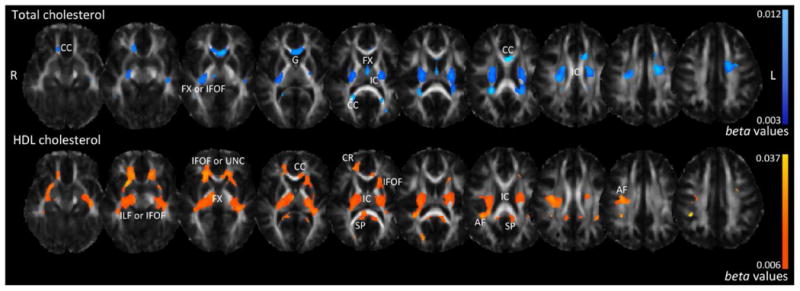
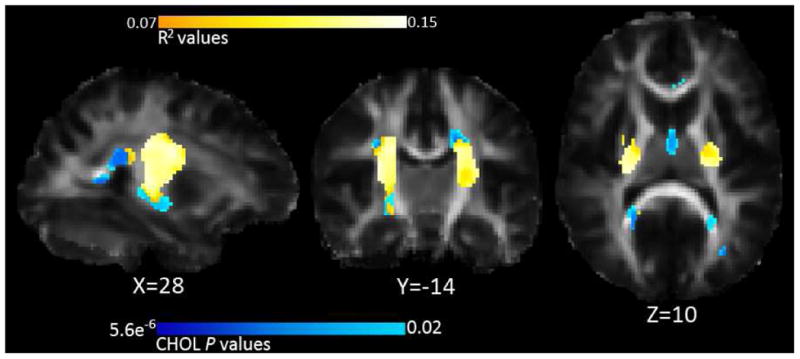
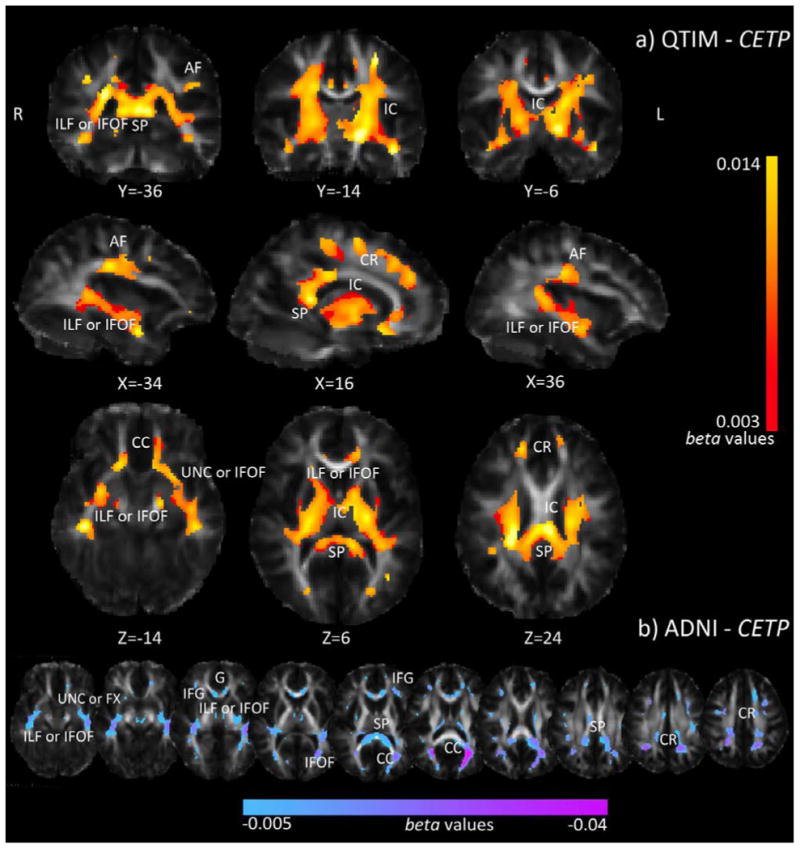
Several common genetic variants influence cholesterol levels, which play a key role in overall health. Myelin synthesis and maintenance are highly sensitive to cholesterol concentrations, and abnormal cholesterol levels increase the risk for various brain diseases, including Alzheimer's disease. We report significant associations between higher serum cholesterol (CHOL) and high-density lipoprotein levels and higher fractional anisotropy in 403 young adults (23.8 ± 2.4 years) scanned with diffusion imaging and anatomic magnetic resonance imaging at 4 Tesla. By fitting a multi-locus genetic model within white matter areas associated with CHOL, we found that a set of 18 cholesterol-related, single-nucleotide polymorphisms implicated in Alzheimer's disease risk predicted fractional anisotropy. We focused on the single-nucleotide polymorphism with the largest individual effects, CETP (rs5882), and found that increased G-allele dosage was associated with higher fractional anisotropy and lower radial and mean diffusivities in voxel-wise analyses of the whole brain. A follow-up analysis detected white matter associations with rs5882 in the opposite direction in 78 older individuals (74.3 ± 7.3 years). Cholesterol levels may influence white matter integrity, and cholesterol-related genes may exert age-dependent effects on the brain.
Keywords: Aging; Brain structure; Cholesterol; DTI; Development; Imaging genetics.
Copyright © 2014 Elsevier Inc. All rights reserved.
Figures
Similar articles
-
Genetic markers of cholesterol transport and gray matter diffusion: a preliminary study of the CETP I405V polymorphism.J Neural Transm (Vienna). 2015 Nov;122(11):1581-92. doi: 10.1007/s00702-015-1434-0. Epub 2015 Aug 8. J Neural Transm (Vienna). 2015. PMID: 26253899 Free PMC article.
-
Associations between white matter microstructure and amyloid burden in preclinical Alzheimer's disease: A multimodal imaging investigation.Neuroimage Clin. 2014 Feb 19;4:604-14. doi: 10.1016/j.nicl.2014.02.001. eCollection 2014. Neuroimage Clin. 2014. PMID: 24936411 Free PMC article.
-
Relation between variants in the neurotrophin receptor gene, NTRK3, and white matter integrity in healthy young adults.Neuroimage. 2013 Nov 15;82:146-53. doi: 10.1016/j.neuroimage.2013.05.095. Epub 2013 May 30. Neuroimage. 2013. PMID: 23727532 Free PMC article.
-
Common Alzheimer's disease risk variant within the CLU gene affects white matter microstructure in young adults.J Neurosci. 2011 May 4;31(18):6764-70. doi: 10.1523/JNEUROSCI.5794-10.2011. J Neurosci. 2011. PMID: 21543606 Free PMC article.
-
Association of increased genotypes risk for bipolar disorder with brain white matter integrity investigated with tract-based spatial statistics: Special Section on "Translational and Neuroscience Studies in Affective Disorders". Section Editor, Maria Nobile MD, PhD. This Section of JAD focuses on the relevance of translational and neuroscience studies in providing a better understanding of the neural basis of affective disorders. The main aim is to briefly summarise relevant research findings in clinical neuroscience with particular regards to specific innovative topics in mood and anxiety disorders.J Affect Disord. 2017 Oct 15;221:312-317. doi: 10.1016/j.jad.2017.06.031. Epub 2017 Jun 15. J Affect Disord. 2017. PMID: 28648753 Review.
Cited by
-
Abdominal obesity and white matter microstructure in midlife.Hum Brain Mapp. 2017 Jul;38(7):3337-3344. doi: 10.1002/hbm.23576. Epub 2017 Apr 8. Hum Brain Mapp. 2017. PMID: 28390146 Free PMC article.
-
The C677T variant in MTHFR modulates associations between brain integrity, mood, and cognitive functioning in old age.Biol Psychiatry Cogn Neurosci Neuroimaging. 2017 Apr;2(3):280-288. doi: 10.1016/j.bpsc.2016.09.005. Biol Psychiatry Cogn Neurosci Neuroimaging. 2017. PMID: 28435933 Free PMC article.
-
Risk Variants in Three Alzheimer's Disease Genes Show Association with EEG Endophenotypes.J Alzheimers Dis. 2021;80(1):209-223. doi: 10.3233/JAD-200963. J Alzheimers Dis. 2021. PMID: 33522999 Free PMC article.
-
Associations Between 20-Year Lipid Variability Throughout Young Adulthood and Midlife Cognitive Function and Brain Integrity.J Gerontol A Biol Sci Med Sci. 2022 Jan 7;77(1):114-121. doi: 10.1093/gerona/glab108. J Gerontol A Biol Sci Med Sci. 2022. PMID: 33839774 Free PMC article.
-
Recent publications from the Alzheimer's Disease Neuroimaging Initiative: Reviewing progress toward improved AD clinical trials.Alzheimers Dement. 2017 Apr;13(4):e1-e85. doi: 10.1016/j.jalz.2016.11.007. Epub 2017 Mar 22. Alzheimers Dement. 2017. PMID: 28342697 Free PMC article. Review.
References
-
- Annett M. A classification of hand preference by association analysis. Br J Psychol. 1970;61(3):303–321. - PubMed
-
- Arias-Vasquez A, Isaacs A, Aulchenko YS, Hofman A, Oostra BA, Breteler M, et al. The cholesteryl ester transfer protein (CETP) gene and the risk of Alzheimer's disease. Neurogenetics. 2007;8(3):189–193. - PubMed
-
- Assaf Y, Pasternak O. Diffusion tensor imaging (DTI)-based white matter mapping in brain research: a review. J Mol Neuro. 2008;34(1):51–61. - PubMed
Publication types
MeSH terms
Substances
Grants and funding
- T32 MH073526/MH/NIMH NIH HHS/United States
- U24 AG021886/AG/NIA NIH HHS/United States
- R01 AG040060/AG/NIA NIH HHS/United States
- 5R01MH094343./MH/NIMH NIH HHS/United States
- EB008432/EB/NIBIB NIH HHS/United States
- U54 EB020403/EB/NIBIB NIH HHS/United States
- EB008281/EB/NIBIB NIH HHS/United States
- P41 EB015922/EB/NIBIB NIH HHS/United States
- EB007813/EB/NIBIB NIH HHS/United States
- R01 EB007813/EB/NIBIB NIH HHS/United States
- RF1 AG041915/AG/NIA NIH HHS/United States
- R01 MH094343/MH/NIMH NIH HHS/United States
- U01 AG024904/AG/NIA NIH HHS/United States
- R01 HD050735/HD/NICHD NIH HHS/United States
- R01 EB008432/EB/NIBIB NIH HHS/United States
- T32 MH073526-06/MH/NIMH NIH HHS/United States
- P41 RR013642/RR/NCRR NIH HHS/United States
- R01 EB008281/EB/NIBIB NIH HHS/United States
- P41RR013642/RR/NCRR NIH HHS/United States
LinkOut - more resources
Full Text Sources
Other Literature Sources
Medical
