

Quantitative mass spectrometry reveals plasticity of metabolic networks in Mycobacterium smegmatis
- PMID: 24997995
- PMCID: PMC4223488
- DOI: 10.1074/mcp.M113.034082
Quantitative mass spectrometry reveals plasticity of metabolic networks in Mycobacterium smegmatis
Abstract
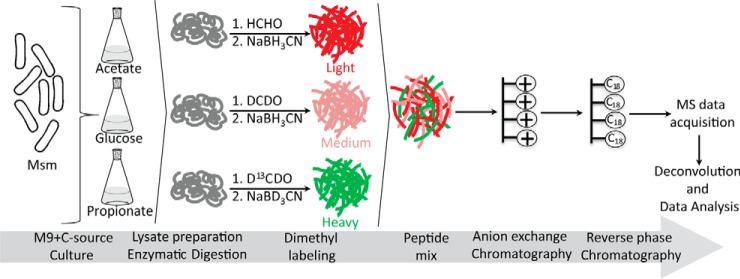
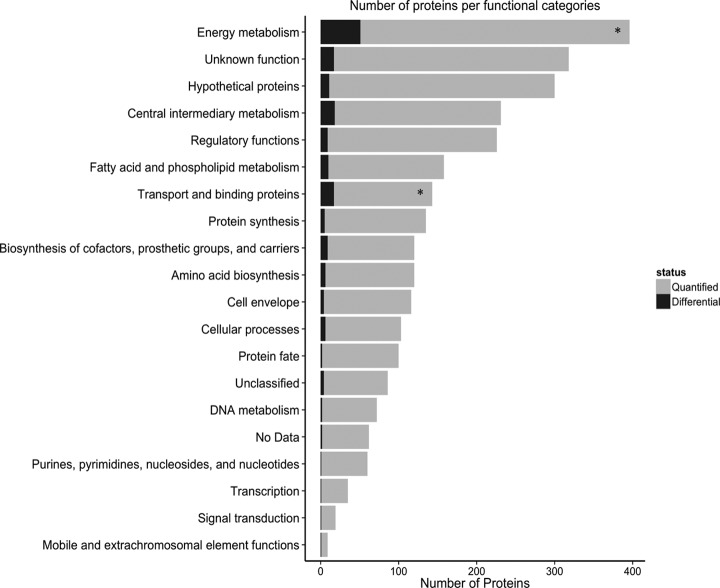
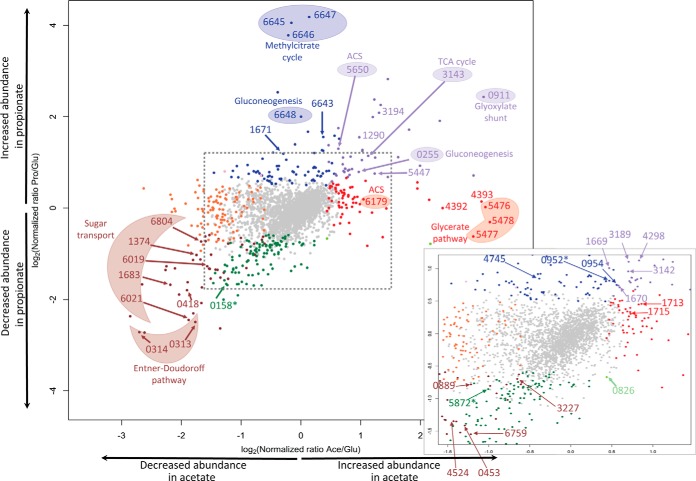
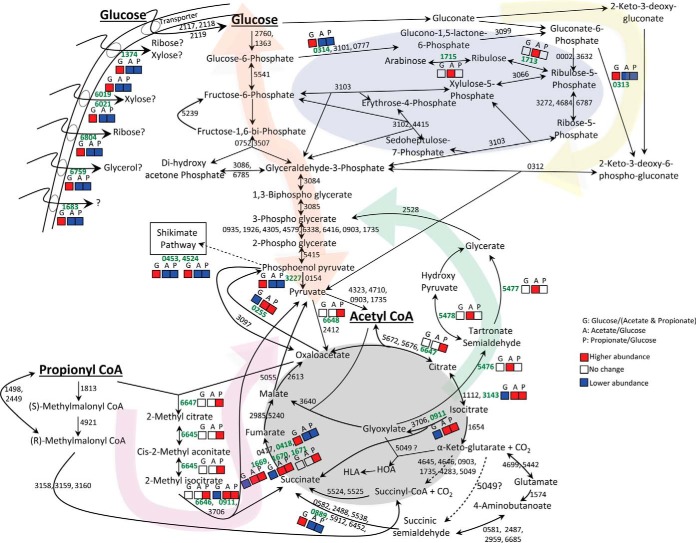
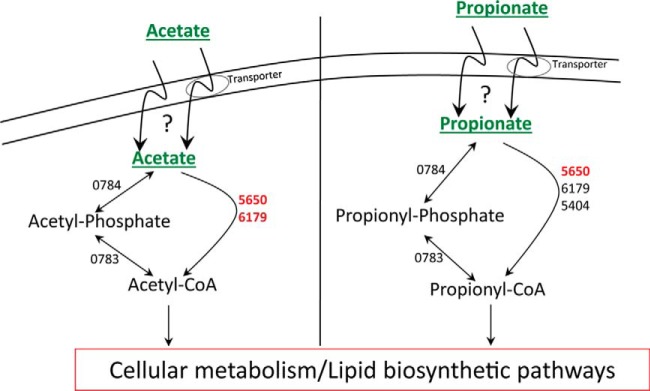
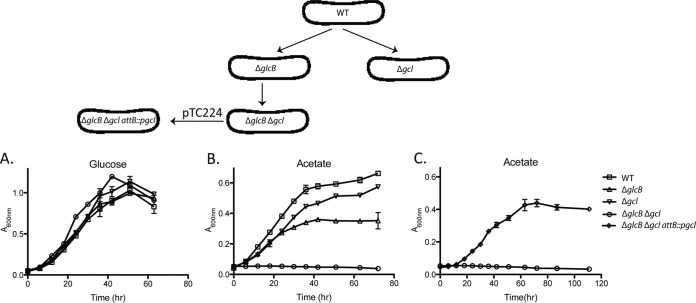
Mycobacterium tuberculosis has a remarkable ability to persist within the human host as a clinically inapparent or chronically active infection. Fatty acids are thought to be an important carbon source used by the bacteria during long term infection. Catabolism of fatty acids requires reprogramming of metabolic networks, and enzymes central to this reprogramming have been targeted for drug discovery. Mycobacterium smegmatis, a nonpathogenic relative of M. tuberculosis, is often used as a model system because of the similarity of basic cellular processes in these two species. Here, we take a quantitative proteomics-based approach to achieve a global view of how the M. smegmatis metabolic network adjusts to utilization of fatty acids as a carbon source. Two-dimensional liquid chromatography and mass spectrometry of isotopically labeled proteins identified a total of 3,067 proteins with high confidence. This number corresponds to 44% of the predicted M. smegmatis proteome and includes most of the predicted metabolic enzymes. Compared with glucose-grown cells, 162 proteins showed differential abundance in acetate- or propionate-grown cells. Among these, acetate-grown cells showed a higher abundance of proteins that could constitute a functional glycerate pathway. Gene inactivation experiments confirmed that both the glyoxylate shunt and the glycerate pathway are operational in M. smegmatis. In addition to proteins with annotated functions, we demonstrate carbon source-dependent differential abundance of proteins that have not been functionally characterized. These proteins might play as-yet-unidentified roles in mycobacterial carbon metabolism. This study reveals several novel features of carbon assimilation in M. smegmatis, which suggests significant functional plasticity of metabolic networks in this organism.
© 2014 by The American Society for Biochemistry and Molecular Biology, Inc.
Figures
Similar articles
-
Regulation of the icl1 Gene Encoding the Major Isocitrate Lyase in Mycobacterium smegmatis.J Bacteriol. 2021 Nov 5;203(23):e0040221. doi: 10.1128/JB.00402-21. Epub 2021 Sep 13. J Bacteriol. 2021. PMID: 34516281 Free PMC article.
-
Methylotrophy in Mycobacteria: Dissection of the Methanol Metabolism Pathway in Mycobacterium smegmatis.J Bacteriol. 2018 Aug 10;200(17):e00288-18. doi: 10.1128/JB.00288-18. Print 2018 Sep 1. J Bacteriol. 2018. PMID: 29891642 Free PMC article.
-
Reversible acetylation regulates acetate and propionate metabolism in Mycobacterium smegmatis.Microbiology (Reading). 2013 Sep;159(Pt 9):1986-1999. doi: 10.1099/mic.0.068585-0. Epub 2013 Jun 27. Microbiology (Reading). 2013. PMID: 23813678 Free PMC article.
-
Features of the biochemistry of Mycobacterium smegmatis, as a possible model for Mycobacterium tuberculosis.J Infect Public Health. 2020 Sep;13(9):1255-1264. doi: 10.1016/j.jiph.2020.06.023. Epub 2020 Jul 13. J Infect Public Health. 2020. PMID: 32674978 Review.
-
Production of recombinant proteins in Mycobacterium smegmatis for structural and functional studies.Protein Sci. 2015 Jan;24(1):1-10. doi: 10.1002/pro.2584. Epub 2014 Nov 13. Protein Sci. 2015. PMID: 25303009 Free PMC article. Review.
Cited by
-
Comparative Proteomic Analyses of Avirulent, Virulent, and Clinical Strains of Mycobacterium tuberculosis Identify Strain-specific Patterns.J Biol Chem. 2016 Jul 1;291(27):14257-14273. doi: 10.1074/jbc.M115.666123. Epub 2016 May 5. J Biol Chem. 2016. PMID: 27151218 Free PMC article.
-
Succinylome analysis reveals the involvement of lysine succinylation in metabolism in pathogenic Mycobacterium tuberculosis.Mol Cell Proteomics. 2015 Apr;14(4):796-811. doi: 10.1074/mcp.M114.045922. Epub 2015 Jan 20. Mol Cell Proteomics. 2015. PMID: 25605462 Free PMC article.
-
Regulation of the icl1 Gene Encoding the Major Isocitrate Lyase in Mycobacterium smegmatis.J Bacteriol. 2021 Nov 5;203(23):e0040221. doi: 10.1128/JB.00402-21. Epub 2021 Sep 13. J Bacteriol. 2021. PMID: 34516281 Free PMC article.
-
Noncanonical SMC protein in Mycobacterium smegmatis restricts maintenance of Mycobacterium fortuitum plasmids.Proc Natl Acad Sci U S A. 2014 Sep 16;111(37):13264-71. doi: 10.1073/pnas.1414207111. Epub 2014 Sep 2. Proc Natl Acad Sci U S A. 2014. PMID: 25197070 Free PMC article.
-
Negative regulation of the acsA1 gene encoding the major acetyl-CoA synthetase by cAMP receptor protein in Mycobacterium smegmatis.J Microbiol. 2022 Dec;60(12):1139-1152. doi: 10.1007/s12275-022-2347-x. Epub 2022 Oct 24. J Microbiol. 2022. PMID: 36279104
References
-
- Rastogi N., Legrand E., Sola C. (2001) The mycobacteria: an introduction to nomenclature and pathogenesis. Rev. Sci. Tech. 20, 21–54 - PubMed
-
- Weigoldt M., Meens J., Bange F. C., Pich A., Gerlach G. F., Goethe R. (2013) Metabolic adaptation of Mycobacterium avium subsp. paratuberculosis to the gut environment. Microbiology 159, 380–391 - PubMed
-
- Schnappinger D., Ehrt S., Voskuil M. I., Liu Y., Mangan J. A., Monahan I. M., Dolganov G., Efron B., Butcher P. D., Nathan C., Schoolnik G. K. (2003) Transcriptional adaptation of Mycobacterium tuberculosis within macrophages: insights into the phagosomal environment. J. Exp. Med. 198, 693–704 - PMC - PubMed
Publication types
MeSH terms
Substances
Grants and funding
LinkOut - more resources
Full Text Sources
Other Literature Sources
Molecular Biology Databases
