. 2014 Dec;53(4):231-40.
doi: 10.1016/j.bcmd.2014.06.002. Epub 2014 Jul 4.

A chemical screen identifies small molecules that regulate hepcidin expression

Affiliations

A chemical screen identifies small molecules that regulate hepcidin expression

Vera Gaun et al. Blood Cells Mol Dis. 2014 Dec.

Abstract

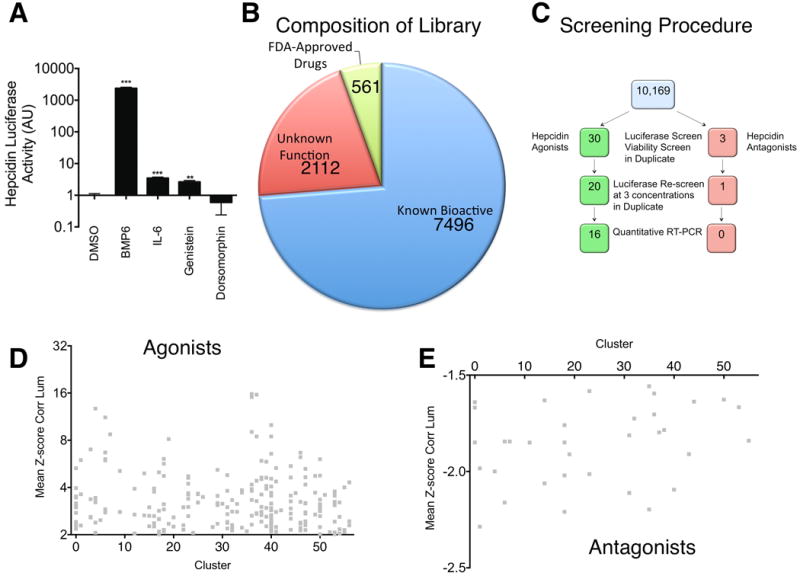
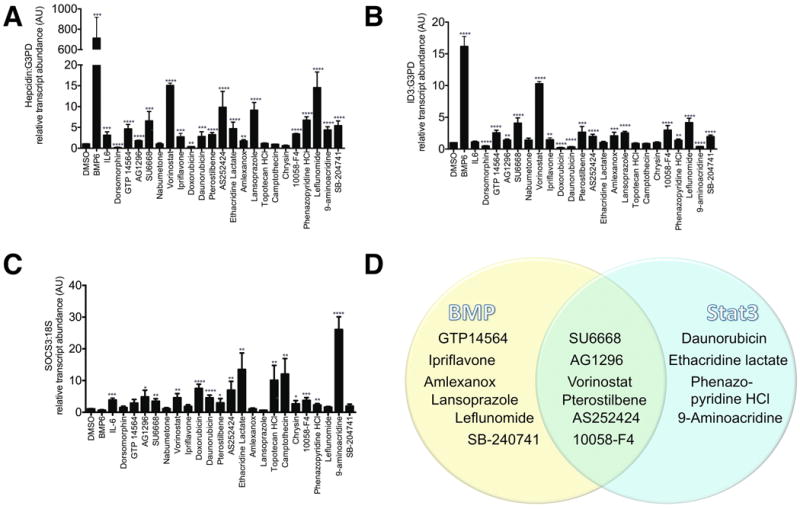
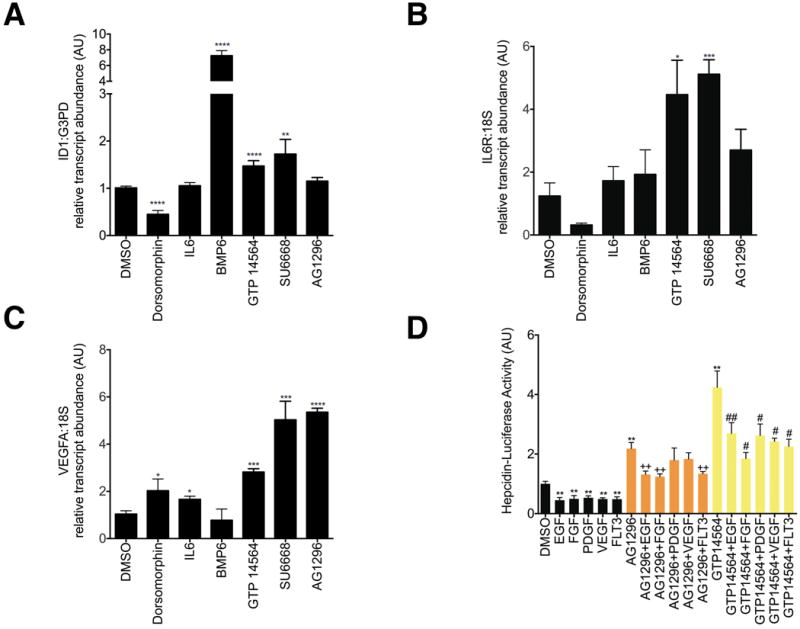
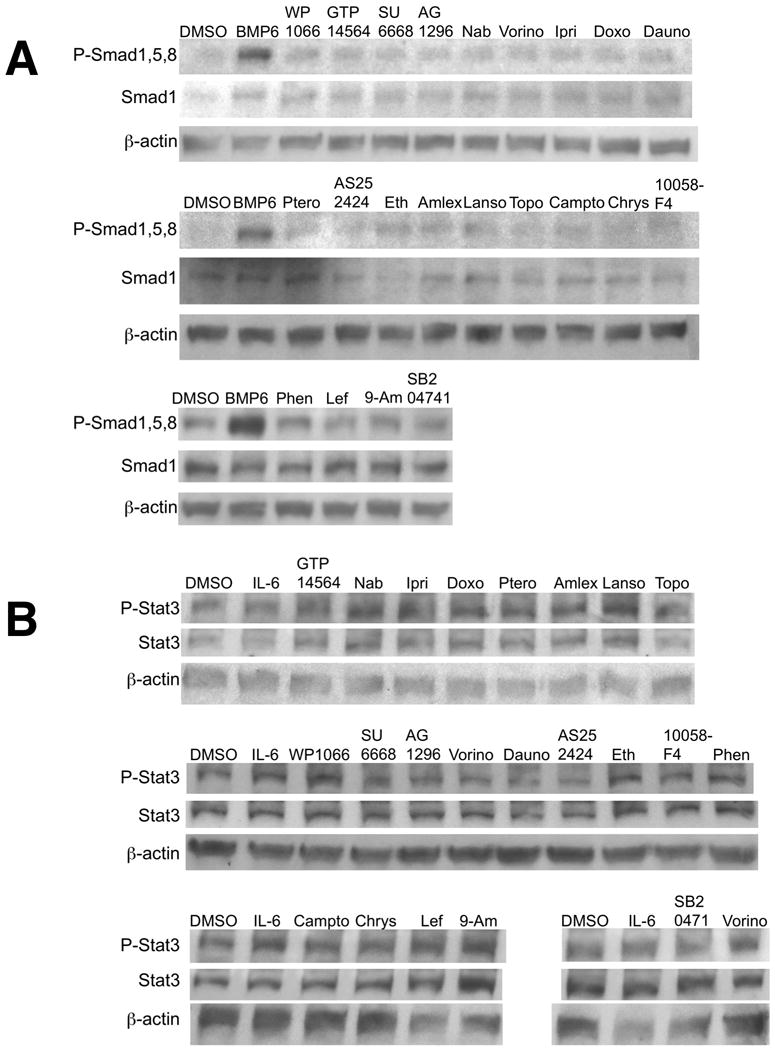
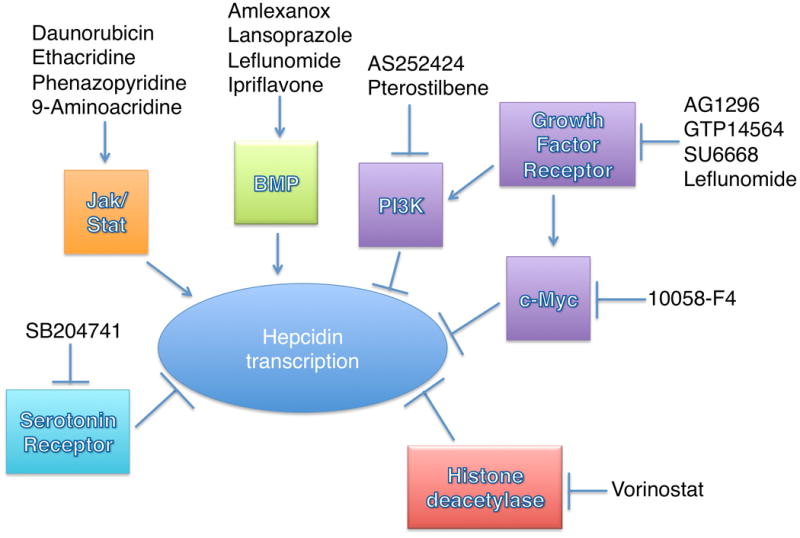
Hepcidin, a peptide hormone produced in the liver, decreases intestinal iron absorption and macrophage iron release via effects on ferroportin. Bone morphogenic protein and Stat3 signaling regulate Hepcidin's transcription. Hepcidin is a potential drug target for patients with iron overload syndromes because its levels are inappropriately low in these individuals. To generate a tool for identifying small molecules that modulate Hepcidin expression, we stably transfected human hepatocytes (HepG2) cells with a reporter construct containing 2.7kb of the human Hepcidin promoter upstream of a firefly reporter gene. We used high throughput methods to screen 10,169 chemicals in duplicate for their effect on Hepcidin expression and cell viability. Regulators were identified as chemicals that caused a change >3 standard deviations above or >1 standard deviation below the mean of the other chemicals (z-score >3 or <1), while not adversely affecting cell viability, quantified by fluorescence assay. Following validation assays, we identified 16 chemicals in a broad range of functional classes that promote Hepcidin expression. All of the chemicals identified increased expression of bone morphogenic protein-dependent and/or Stat3-dependent genes, however none of them strongly increased phosphorylation of Smad1,5,8 or Stat3.

Keywords: Bone morphogenic protein; Hemochromatosis; Interleukin-6; Stat3; Thalassemia.


Figures

Figure 1
Figure 1
A. Effect of positive and negative controls on Hepcidin-luciferase activity in stably transfected HepG2 cells. After 16 hours of serum starvation in α-MEM/0% FBS, HepG2 cells stably transfected with Hepcidin-luciferase were treated for 24 hours with DMSO 1%, BMP6 50 ng/ml, IL-6 100 ng/ml, Genistein 10 μM, or Dorsomorphin 40 μM. Hepcidin-luciferase activity was measured using the OneGlo Assay (Promega) and is shown as mean fold-change over DMSO-treated control. The global P-value generated using the Kruskal-Wallis test was <0.0001. Unpaired Student's t-tests were performed compared to DMSO alone. ***denotes 0.0001≤P<0.0009 and **denotes 0.0009≤P<0.009. N=3 biological replicates per condition. B. Library Composition. The screening library included known bioactive molecules, molecules of unknown function, and FDA-approved drugs. C. Screening Method. 10,169 chemicals were evaluated for Hepcidin-luciferase activity and viability in HepG2 cells stably transfected with a Hepcidin-luciferase promoter construct. The hits were then re-evaluated in the same assay at three concentrations and in a quantitative realtime RT-PCR assay. D,E. Scatter-plot of structural cluster vs. mean z-score for Hepcidin-luciferase activity for 343 molecules found to increase (D) or 62 molecules found to decrease (E) Hepcidin-luciferase activity.
Figure 2
Figure 2
Quantitative realtime RT-PCR for A. Hepcidin, B. ID3, C. SOCS3. Following 8 hours of serum starvation in α-MEM/1%FBS, HepG2 cells were treated for 24 hours in α-MEM/1%FBS with DMSO 1%, BMP6 100 ng/ml, IL-6 100 ng/ml, dorsomorphin (an inhibitor of BMP signaling) 10 μM, GTP 14564 5 μM, AG1296 5 μM, SU6668 10 μM, nabumetone 5 μM, vorinostat 1 μM, ipriflavone 1 μM, doxorubicin 10 μM, daunorubicin 10 μM, pterostilbene 10 μM, AS252424 33 μM, ethacridine lactate 33 μM, amlexanox 33 μM, lansoprazole 33 μM, topotecan HCl 33 μM, camptothecin 33 μM, chrysin 33 μM, 10058-F4 33 μM, phenazopyridine 33 μM, leflunomide 33 μM, 9-aminoacridine 33 μM, SB-204741 33 μM. RNA was then extracted for quantitative realtime RT-PCR. Data shown are means±SE's. N=3-6 biological replicates per treatment. The global P-value generated using the Kruskal-Wallis test was <0.0001 for each experiment. Unpaired Student's t-tests were performed compared to DMSO alone. * denotes 0.009≤P<0.05, **denotes 0.0009≤P<0.009, ***denotes 0.0001≤P<0.0009, ****P<0.0001. D. Venn diagram illustrating which chemicals appear to increase RNA transcript levels of Hepcidin and the BMP-dependent transcript, ID3, and/or the Stat3-dependent transcript, SOCS3.
Figure 3
Figure 3
A-C. Effect of AG1296 and GTP 14564 on transcript levels of ID1(A), IL6 receptor (B), and VEGFA (C). HepG2 cells were treated with chemicals at the same doses and with the same conditions as described in Figure 2. Data shown are means±SE's. N=3-6 biological replicates per treatment. The global P-value generated using the Kruskal-Wallis test was <0.0001 for ID1 and =0.01 for IL6R and VEGFA. Unpaired Student's t-tests were performed compared to DMSO alone. * denotes 0.009≤P<0.05, **denotes 0.0009≤P<0.009, ***denotes 0.0001≤P<0.0009, ****P<0.0001. D. Effect of AG1296 or GTP 14564 on Hepcidin-Luciferase Activity in the presence or absence of growth factors or FLT3. After 16 hours of serum starvation in α-MEM/0% FBS, HepG2 cells stably transfected with Hepcidin-luciferase were treated for 24 hours with AG1296 (5 μM) or GTP 14564 (5 μM) in the presence or absence of EGF 150 ng/ml, FGF 200 ng/ml, PDGF 50 ng/ml, VEGF 150 ng/ml, or FLT3 150 ng/ml. Hepcidin-luciferase activity was measured using the OneGlo Assay (Promega) and is shown as mean fold-change over DMSO-treated control. The global P-value generated using the Kruskal-Wallis test was <0.0001. Unpaired Student's t-tests were performed. ** denotes 0.0009≤P<0.009, compared to DMSO-treated control. ++ denotes 0.0009≤P<0.009, compared to AG1296-treated cells. # denotes 0.009≤P<0.05, compared to GTP 14564-treated cells. ## denotes 0.0009≤P<0.009, compared to GTP 14564-treated cells. N=5-9 biological replicates for each condition.
Figure 4
Figure 4. Western blots
Following 16 hours of serum starvation in α-MEM/1%FBS, HepG2 cells were treated for 1 hour in α-MEM/1%FBS with the chemicals at the same concentrations as given in Figure 2. Protein was extracted from the cells, separated by SDS-PAGE, and blotted for incubation with antibodies against anti-P-Smad1,5,8 (A) or P-Stat3 (B). Following immunoblotting, the membranes were stripped and re-probed with either antibody against anti-Smad1,5,8 (A) or Stat3 (B). The blots were then stripped again and probed for β-actin as a loading control. Each chemical was evaluated in two or three biological replicates.
Figure 5
Figure 5. Schematic illustrating the pathways implicated in transcriptional regulation of Hepcidin by the small molecules identified as Hepcidin stimulators in the screen
->Indicates a stimulatory effect, while -| indicates an inhibitory effect.

References

    1. Ganz T, Nemeth E. Hepcidin and iron homeostasis. Biochim Biophys Acta. 2012;1823(9):1434–43. - PMC - PubMed
    1. Collins JF, Wessling-Resnick M, Knutson MD. Hepcidin regulation of iron transport. J Nutr. 2008;138(11):2284–8. - PMC - PubMed
    1. Corradini E, et al. Serum and liver iron differently regulate the bone morphogenetic protein 6 (BMP6)-SMAD signaling pathway in mice. Hepatology. 2011;54(1):273–84. - PMC - PubMed
    1. Wang RH, et al. A role of SMAD4 in iron metabolism through the positive regulation of hepcidin expression. Cell Metab. 2005;2(6):399–409. - PubMed
    1. Wrighting DM, Andrews NC. Interleukin-6 induces hepcidin expression through STAT3. Blood. 2006;108(9):3204–9. - PMC - PubMed

Publication types

MeSH terms