. 2014 Jul 17;158(2):263-276.
doi: 10.1016/j.cell.2014.06.017. Epub 2014 Jul 3.

Disruptive CHD8 mutations define a subtype of autism early in development

Affiliations

Disruptive CHD8 mutations define a subtype of autism early in development

Raphael Bernier et al. Cell. .

Abstract

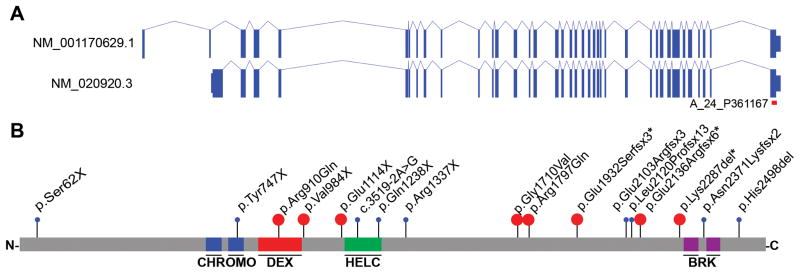
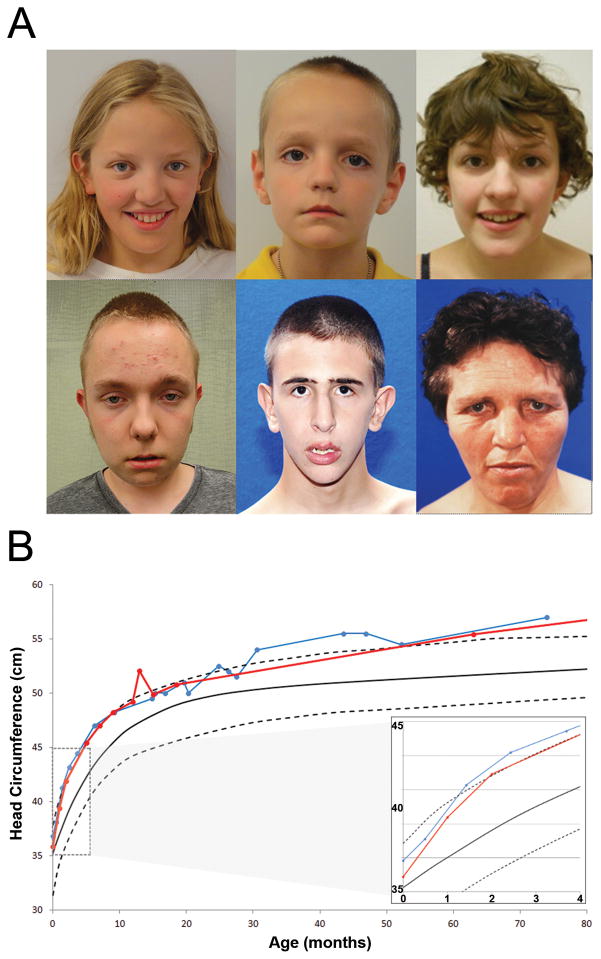
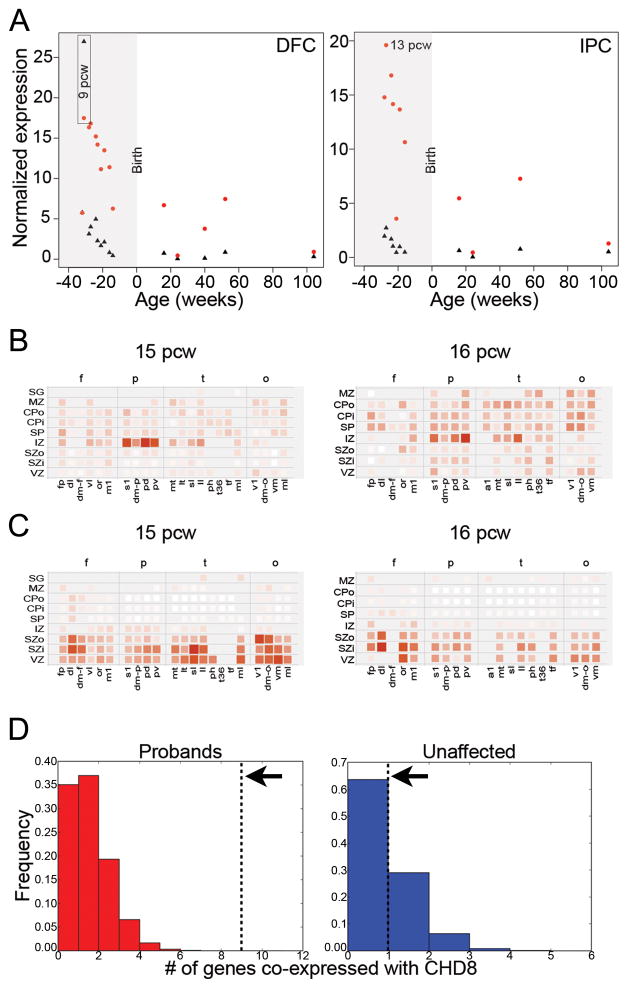
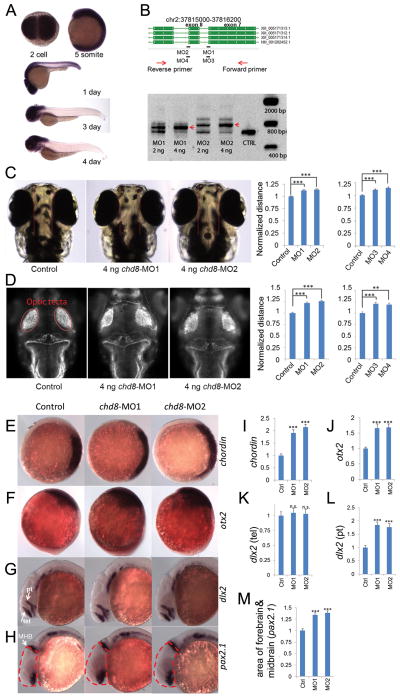
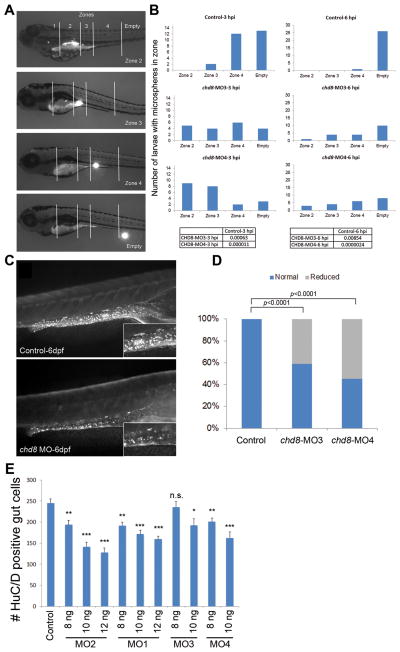
Autism spectrum disorder (ASD) is a heterogeneous disease in which efforts to define subtypes behaviorally have met with limited success. Hypothesizing that genetically based subtype identification may prove more productive, we resequenced the ASD-associated gene CHD8 in 3,730 children with developmental delay or ASD. We identified a total of 15 independent mutations; no truncating events were identified in 8,792 controls, including 2,289 unaffected siblings. In addition to a high likelihood of an ASD diagnosis among patients bearing CHD8 mutations, characteristics enriched in this group included macrocephaly, distinct faces, and gastrointestinal complaints. chd8 disruption in zebrafish recapitulates features of the human phenotype, including increased head size as a result of expansion of the forebrain/midbrain and impairment of gastrointestinal motility due to a reduction in postmitotic enteric neurons. Our findings indicate that CHD8 disruptions define a distinct ASD subtype and reveal unexpected comorbidities between brain development and enteric innervation.


Figures

Figure 1
Figure 1. Spectrum of CHD8 mutations in autism spectrum disorder
A) Gene isoforms 1 & 2 and B) protein models of CHD8 with proband putative disruptive mutations indicated. The location of the gene expression array probe used for Figure 3 (A_24_P361167) is shown in Figure 1A in red. Events in blue were reported previously (Neale et al., 2012; O’Roak et al., 2012a). Events in red are novel. *=diagnosis of intellectual disability (Table 1). See also Table S1 & S2; Figure S1.
Figure 2
Figure 2. Physical characteristics of the CHD8 phenotype
A) Facial phenotype associated with CHD8. Patients 11654.p1 (top left), 14016.p1 (top middle), and Nij023486 (top right) present with macrocephaly, hypertelorism, down slanted palpebral fissures, broad nose, pointed chin, and broad forehead with prominent supraorbital ridge. Patient 12991.p1 (bottom left) has a high forehead, hypertelorism, large ears, fleshy earlobes, and a history of macrocephaly (at 12 years of age). Patient Troina2659 (bottom middle) did not have hypertelorism but did present with macrocephaly, down slanted palpebral fissures, prominent supraorbital ridge, and pointed chin. Additional physical features included posterior plagiocephaly. Patient Troina2037 (bottom right) presented with macrocephaly, hypertelorism, down slanted palpebral fissures, prominent supraorbital ridges, large ears with fleshy upturned lobes, and full fleshy lips. Additional physical features included widened cranial vault observed via CT scan. B) Longitudinal head circumference in CHD8 patients. Analysis of standardized head circumference values for patients 14016.p1 (in red) and APP_109580-100 (in blue) reveal marked early orbital frontal head growth in the first two months post birth followed by consistent large head growth remaining at or above 97th percentile throughout early childhood.
Figure 3
Figure 3. Normal expression of CHD8
A) Reads per kilobase per million normalized expression values of CHD8 (red) and CHD7 (black) in dorsolateral prefrontal cortex (DFC, left) and posteroventral (inferior) parietal cortex (IPC, right) over a range from 8 post-conception weeks (pcw) to 104 weeks (2 years) of age taken from normal post-autopsy individuals. Highlighted in gray is expression in the fetal brain prior to birth. B–C) Heatmap showing localized expression of CHD8 (B) or CHD7 (C) at 15 pcw (left) and 16 pcw (right) in the intermediate zone (IZ). Red indicates increased expression and white indicates no expression. Cortical samples are organized in columns by lobe (f=frontal; p=parietal; t=temporal; o=occipital) and in rows by layer from basal to apical surfaces of the developing neocortex (SG=suprageniculate nucleus of the thalamus; MZ=marginal zone; CPo=outer cortical plate; CPi=inner cortical plate; SP=subplate zone; SZo=outer subventricular zone; SZi=inner subventricular zone; VZ=ventricular zone). Within lobes, samples are approximately ordered from rostral to caudal. a1=primary auditory cortex; dl=dorsolateral prefrontal cortex; dm-f=dorsomedial frontal cortex; dm-o=dorsomedial extrastriate cortex; dm-p=dorsomedial parietal cortex (area 7m); fp=frontal polar cortex; il=inferolateral temporal cortex; lt=lateral temporal-occipital cortex; m1=posterior frontal cortex (motor cortex); mi-t=midinferior temporal cortex; ml=midlateral extrastriate cortex; mt=medial temporal-occipital cortex; or=orbital frontal cortex; pd=posterosuperior (dorsal) parietal cortex; ph=posterior parahippocampal cortex; pv=posteroinferior (ventral) parietal cortex; s1=primary somatosensory cortex; sl=superolateral temporal cortex; t36=(rostral) midinferior temporal cortex (area 36); tf=caudal midinferior temporal cortex (area TF); tp=temporal polar cortex; v1=primary visual cortex; vl=ventrolateral prefrontal cortex; vm=ventromedial extrastriate cortex. D) CHD8 is co-expressed with nine genes carrying truncated mutations in ASD probands (n=133, red, left panel) and one gene carrying disruptive mutations in unaffected siblings and controls (n=58, blue, right panel) (Gulsuner et al., 2013; Rauch et al., 2012) with Pearson correlation r>0.9 (black dashed lines). For comparison, 100,000 random sets of genes of the same size (n=133, left; n=58, right) were sampled. The histogram shows the number of genes from each such random set that are co-expressed with CHD8. CHD8 is found to co-express with a significantly higher number of genes reported as sites for de novo truncated mutations in ASD probands (p<1×10⁻⁵) in contrast to unaffected siblings and controls, which was not significant (p=0.37). See also Figures S2 & S3, Tables S3 & S4.
Figure 4
Figure 4. chd8 disruption results in ectopic expression of forebrain/midbrain markers during zebrafish development
In situ hybridization is shown for multiple markers before and after injection of chd8-MO1-4. A) In situ hybridization of 2-cell, 5-somite, 1-, 3- and 4-day stage zebrafish embryos using a 1.5 kbp chd8 antisense probe. chd8 is ubiquitously expressed in early stages; however, after day 1, its expression is enriched in the head region and the GI duct. B) Two sets of morpholinos are independently designed to target two exon/intron junctions of chd8. To validate the morpholino effects, total mRNA was extracted at 24 hours post-fertilization (hpf) followed by reverse transcription and PCR using primers flanking the targeted junctions. MO1 or MO2 injection leads to inclusion of the adjacent intron to mature mRNA. Red arrows indicate the PCR products of morpholino-modified chd8 transcripts. Uninjected AB strain embryos were used as control for all experiments in Figure 4. Data are represented as mean +/− SEM. C) The distance between the convex tips of the eyes were measured. MO1, MO2, MO3, and MO4 injection caused enlargement of this distance and the results were quantified in the right panel. D) Embryos were immunostained to highlight the neuronal axon tract in the developing brains. Embryos are imaged in dorsal view and the optic tecta structure is indicated (red oval). The average distance between the optic tecta is measured and quantified (n=50). Injection of chd8-MO1, MO2, MO3, and MO4 showed an enlargement of the distance consistent with interorbital distance measurements. Data are represented as mean +/− SEM. E) Expression of chordin (marker of the dorsal organizing region) at shield stage, animal pole view and dorsal oriented towards right. Chordin expression is expanded upon injection of chd8 morpholinos and the overall staining intensity is quantified in panel E. F) Orthodenticle homeobox 2 (otx2), an early marker of midbrain and forebrain neuronal progenitors. Expression of otx2 at tail bud stage, lateral view and dorsal oriented towards the right. Otx2 expression is enhanced upon injection of chd8 morpholinos and the overall staining intensity is quantified in panel F. G) Distal-less homeobox 2 (dlx2), a marker of neural stem cells. Expression of dlx2 at 24-hour stage, lateral view. Arrows point at the telencephalon (tel) region and arrowhead points at the prethalamus (pt) region. dlx2 expression in the prethalamus but not telencephalon region is enhanced upon injection of chd8 morpholinos as shown in panel H (pt) and G (tel), respectively. H) Paired-box 2.1 (pax2.1), a marker of the midbrain/hindbrain boundary (MHB). Expression of pax2.1 at 24-hour stage, lateral view. Arrow points at MHB. The area of the head that contains the forebrain and midbrain is outlined by dashed red lines. The forebrain/midbrain region is enlarged upon injection of chd8 morpholinos, which is quantified in panel I. I–M) Quantification of significant in situ hybridization results. n.s.=not significant; **p<0.001; ***p<0.0001. Data are represented as mean +/− SEM. See also Figures S4, S5 & S6.
Figure 5
Figure 5. Analysis of GI motility by microgavage assay
A) Example of intestinal transit within one larva over time. Intestinal zones are indicated in the top image (zones 1–4). Images below show fluorescent signal in the different intestinal zones outlined by white solid lines. B) The most rostral location of microspheres was used to determine the transit zone scores. Bars represent the total number of larvae containing microspheres in each zone, and numbers at the top of each graph indicate the time elapsed after gavage (hours post-injection, hpi). Numbers of larvae injected and scored are as follow: 27 sham-injected, 19 chd8-MO3-injected, and 22 chd8-MO4-injected. The microgavage experiment was repeated three times. Fisher’s exact test was performed; associated p-values are shown in the corresponding tables. C) Injection of chd8-MO leads to a reduced number of enteric neurons in the GI tract at 6 days post-fertilization (dpf). Representative photographs (with HuC/D-antibody staining) show the lateral views of a sham-injected zebrafish larva (control) and a zebrafish larva injected with chd8 MO. Higher magnification of the GI tract, displayed in the insets, shows a reduced number of enteric neurons (labeled by anti-HuC/D antibody) in larvae injected with chd8 MOs compared to controls. D) Bar graph represents the percentage of larvae (controls and injected with chd8-MO3 and -MO4) with reduced number of enteric neurons at 6 dpf. Corresponding p-values are denoted on the bar graph (Pearson’s chi-squared test). E) Increasing the dosage of MO1-2 injection from 8 to12 ng and MO3-4 from 8 to10 ng resulted in a significant decrease in enteric neurons in the gut at 6 dpf measured by HuC/D positive cells. n.s.=not significant; *p<0.05; **p<0.001; ***p<0.0001 (Student’s t-test). Data are represented as mean +/− SEM. See also Figure S4 & S5.

References

    1. American Psychiatric Association. Diagnostic and Statistical Manual of Mental Disorders. 4. Washington, DC: American Psychiatric Association; 2000. Text Revision (DSM-IV-TR)
    1. American Psychiatric Association. Diagnostic and Statistical Manual of Mental Disorders. 5. Washington, DC: American Psychiatric Association; 2013. (DSM-5)
    1. Batsukh T, Pieper L, Koszucka AM, von Velsen N, Hoyer-Fender S, Elbracht M, Bergman JE, Hoefsloot LH, Pauli S. CHD8 interacts with CHD7, a protein which is mutated in CHARGE syndrome. Hum Mol Genet. 2010;19:2858–2866. - PubMed
    1. Betancur C. Etiological heterogeneity in autism spectrum disorders: more than 100 genetic and genomic disorders and still counting. Brain research. 2011;1380:42–77. - PubMed
    1. Butler MG, Dasouki MJ, Zhou XP, Talebizadeh Z, Brown M, Takahashi TN, Miles JH, Wang CH, Stratton R, Pilarski R, et al. Subset of individuals with autism spectrum disorders and extreme macrocephaly associated with germline PTEN tumour suppressor gene mutations. J Med Genet. 2005;42:318–321. - PMC - PubMed

Publication types

MeSH terms