

Weighted comparison of two cumulative incidence functions with R-CIFsmry package
- PMID: 24999008
- PMCID: PMC4285697
- DOI: 10.1016/j.cmpb.2014.05.008
Weighted comparison of two cumulative incidence functions with R-CIFsmry package
Abstract
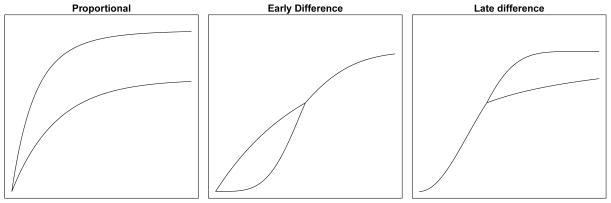
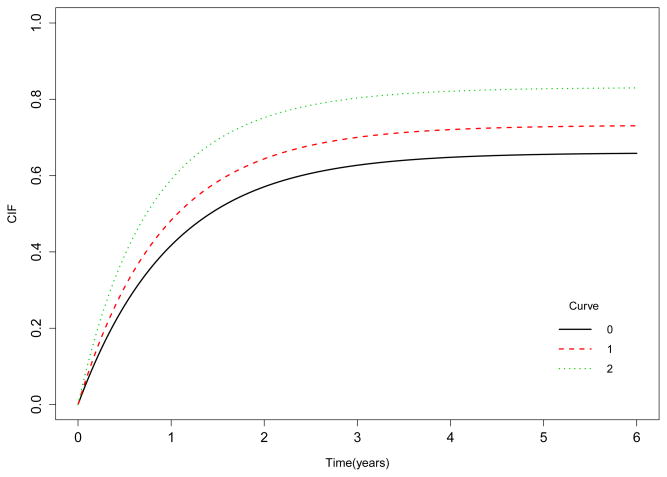
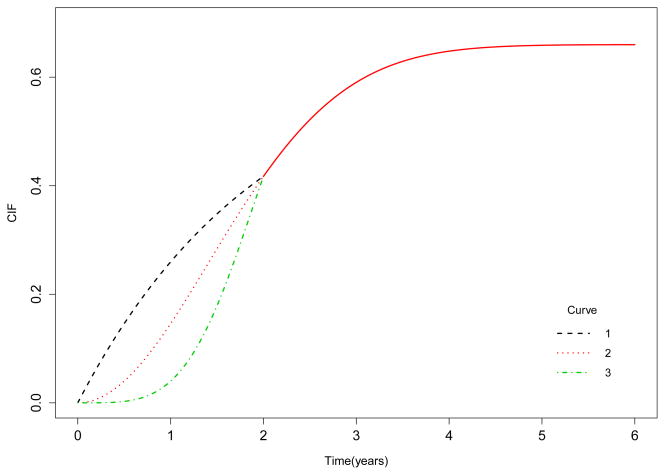
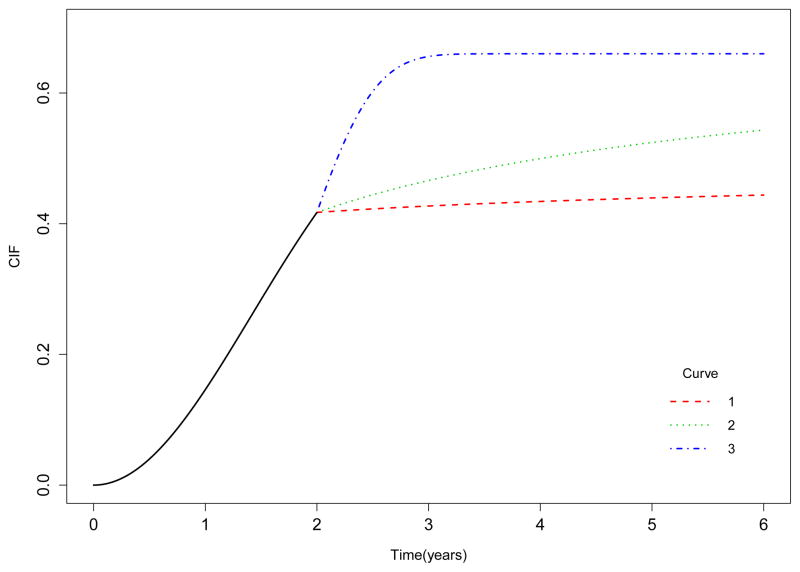
In this paper we propose a class of flexible weight functions for use in comparison of two cumulative incidence functions. The proposed weights allow the users to focus their comparison on an early or a late time period post treatment or to treat all time points with equal emphasis. These weight functions can be used to compare two cumulative incidence functions via their risk difference, their relative risk, or their odds ratio. The proposed method has been implemented in the R-CIFsmry package which is readily available for download and is easy to use as illustrated in the example.
Keywords: Competing risks; Cumulative incidence functions; Risk difference; Weighted comparison.
Copyright © 2014 Elsevier Ireland Ltd. All rights reserved.
Conflict of interest statement
The authors have no conflict of interest to declare.
Figures
Similar articles
-
Semiparametric competing risks regression under interval censoring using the R package intccr.Comput Methods Programs Biomed. 2019 May;173:167-176. doi: 10.1016/j.cmpb.2019.03.002. Epub 2019 Mar 8. Comput Methods Programs Biomed. 2019. PMID: 31046992 Free PMC article.
-
Cause-specific cumulative incidence estimation and the fine and gray model under both left truncation and right censoring.Biometrics. 2011 Mar;67(1):39-49. doi: 10.1111/j.1541-0420.2010.01420.x. Biometrics. 2011. PMID: 20377575
-
mlegp: statistical analysis for computer models of biological systems using R.Bioinformatics. 2008 Sep 1;24(17):1966-7. doi: 10.1093/bioinformatics/btn329. Epub 2008 Jul 17. Bioinformatics. 2008. PMID: 18635570 Free PMC article.
-
Tutorial on kernel estimation of continuous spatial and spatiotemporal relative risk.Stat Med. 2018 Mar 30;37(7):1191-1221. doi: 10.1002/sim.7577. Epub 2017 Dec 11. Stat Med. 2018. PMID: 29226352 Review.
-
A competing risks analysis should report results on all cause-specific hazards and cumulative incidence functions.J Clin Epidemiol. 2013 Jun;66(6):648-53. doi: 10.1016/j.jclinepi.2012.09.017. Epub 2013 Feb 14. J Clin Epidemiol. 2013. PMID: 23415868 Review.
Cited by
-
Implementation of an Alternative Method for Assessing Competing Risks: Restricted Mean Time Lost.Am J Epidemiol. 2022 Jan 1;191(1):163-172. doi: 10.1093/aje/kwab235. Am J Epidemiol. 2022. PMID: 34550319 Free PMC article.
-
Risk Factors and Incidence of Epilepsy after Severe Traumatic Brain Injury.Ann Neurol. 2022 Oct;92(4):663-669. doi: 10.1002/ana.26443. Epub 2022 Aug 3. Ann Neurol. 2022. PMID: 35713346 Free PMC article.
References
-
- Kalbfleisch JD, Prentice RL. The Statistical Analysis of Failure Time Data. Wiley; New York: 2002.
-
- Kaplan EL, Meier P. Non-parametric estimation from incomplete observations. J Amer Statist Assoc. 1958;53:457–481.
-
- Cox DR. Regression models and life tables (with discussion) J Roy Statist Soc Ser B. 1972;34:187–220.
-
- Prentice RL, Kalbfleisch JD, Peterson AV, Flournoy N, Farewell VT, Breslow N. The analysis of failure time data in the presence of competing risks. Biometrics. 1978;34:541–554. - PubMed
-
- Cheng SC, Fine JP, Wei LJ. Prediction of cumulative incidence function under the proportional hazards model. Biometrics. 1998;54:219–228. - PubMed
Publication types
MeSH terms
Grants and funding
LinkOut - more resources
Full Text Sources
Other Literature Sources
