

A novel gene SbSI-2 encoding nuclear protein from a halophyte confers abiotic stress tolerance in E. coli and tobacco
- PMID: 24999628
- PMCID: PMC4084957
- DOI: 10.1371/journal.pone.0101926
A novel gene SbSI-2 encoding nuclear protein from a halophyte confers abiotic stress tolerance in E. coli and tobacco
Abstract
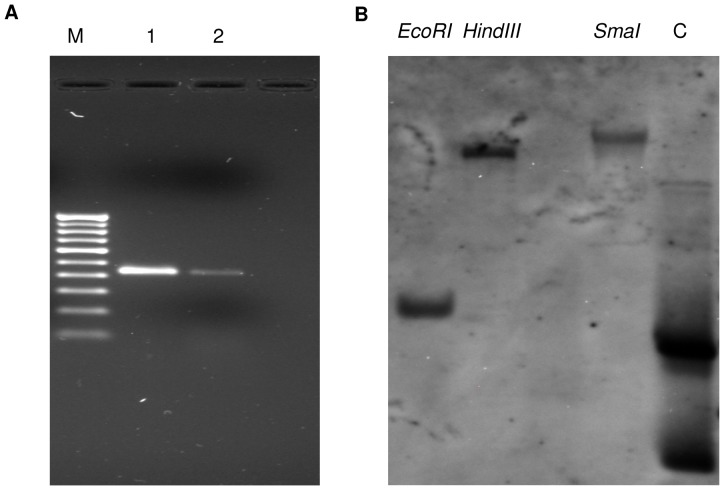
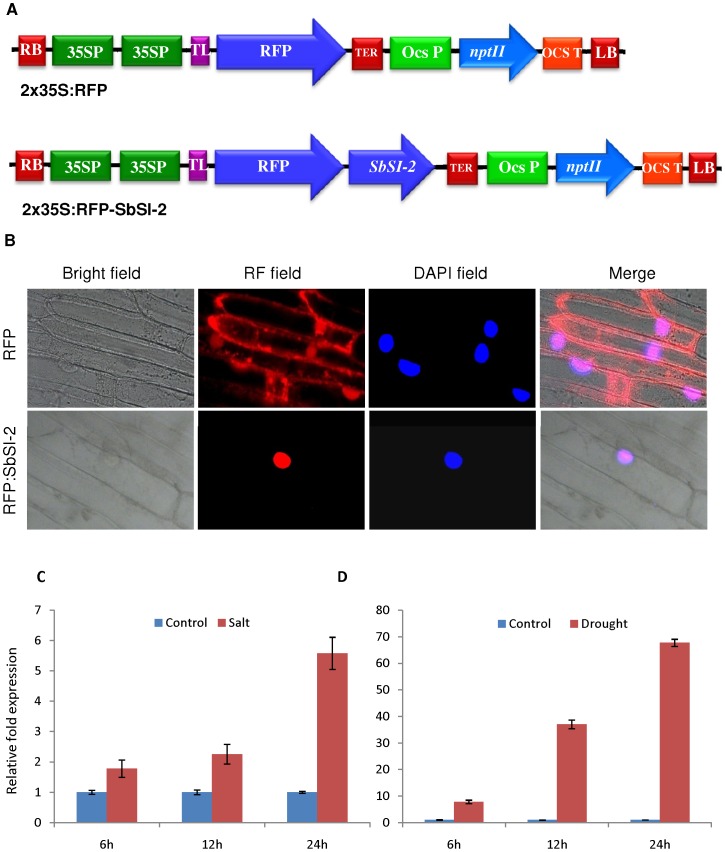
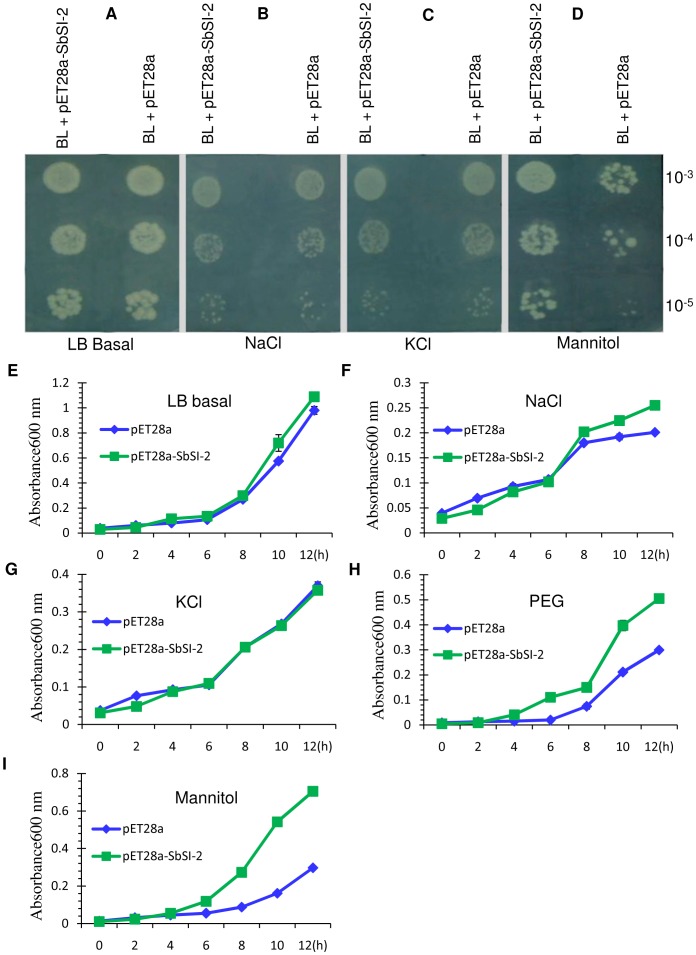
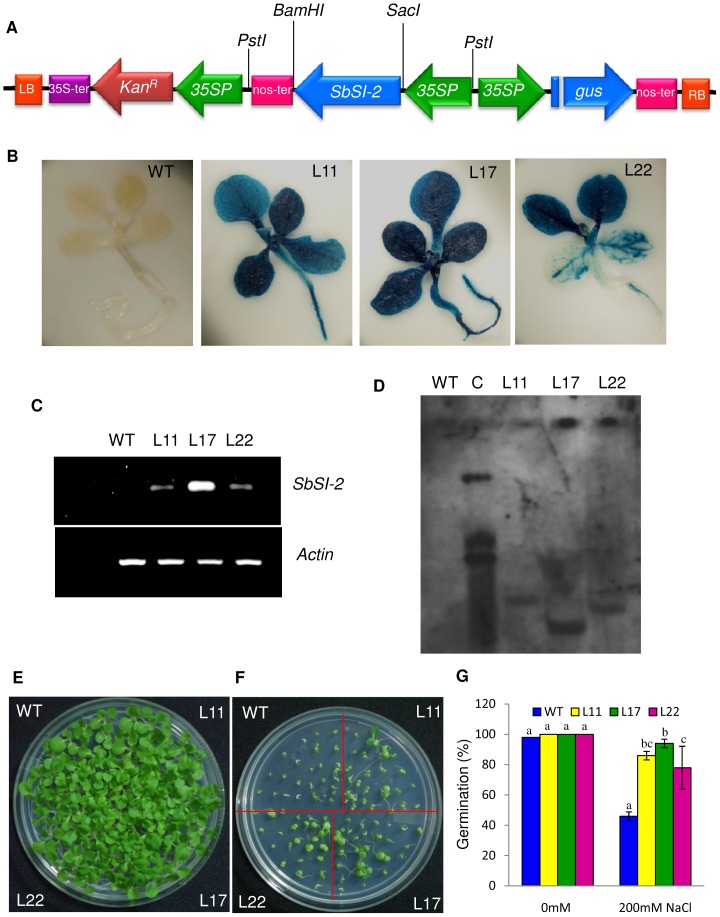
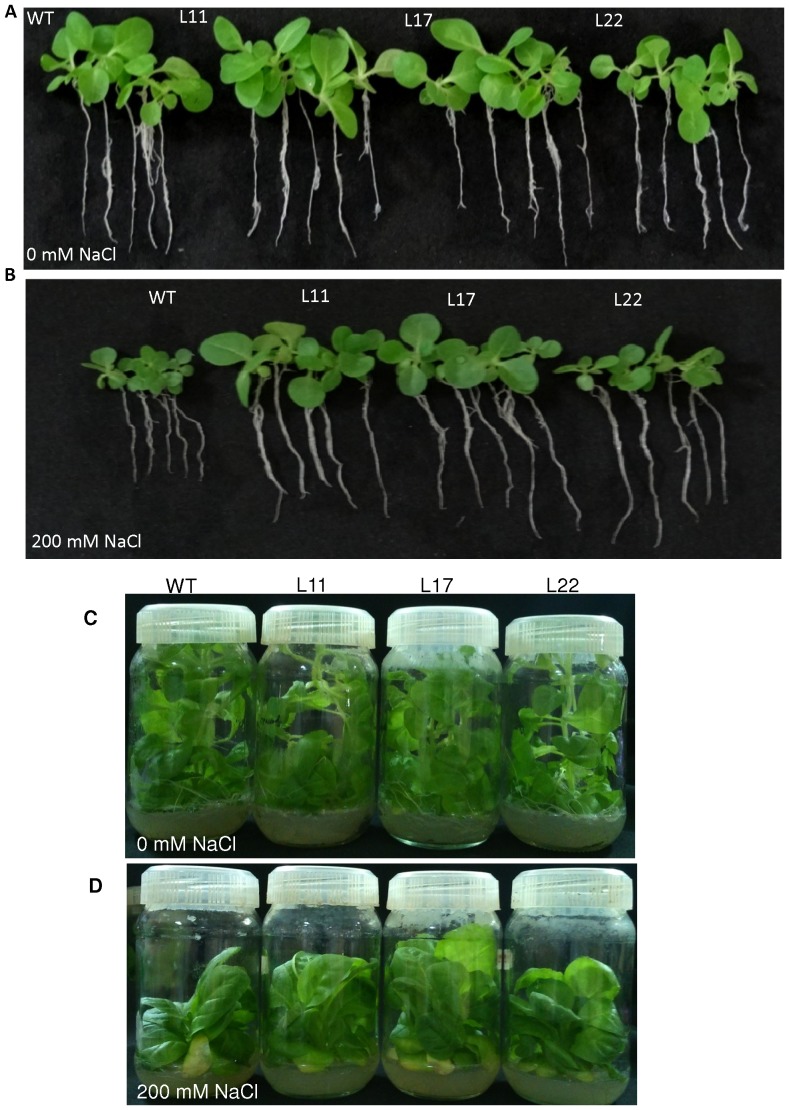
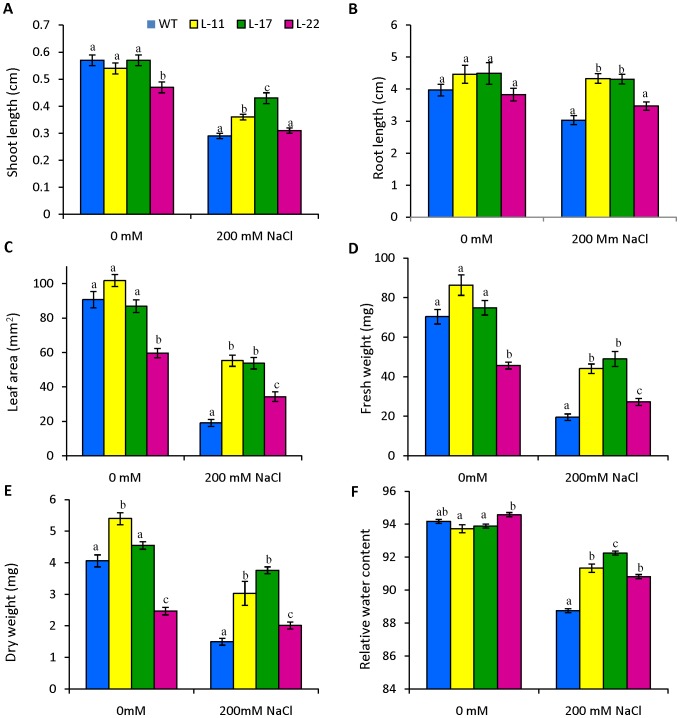
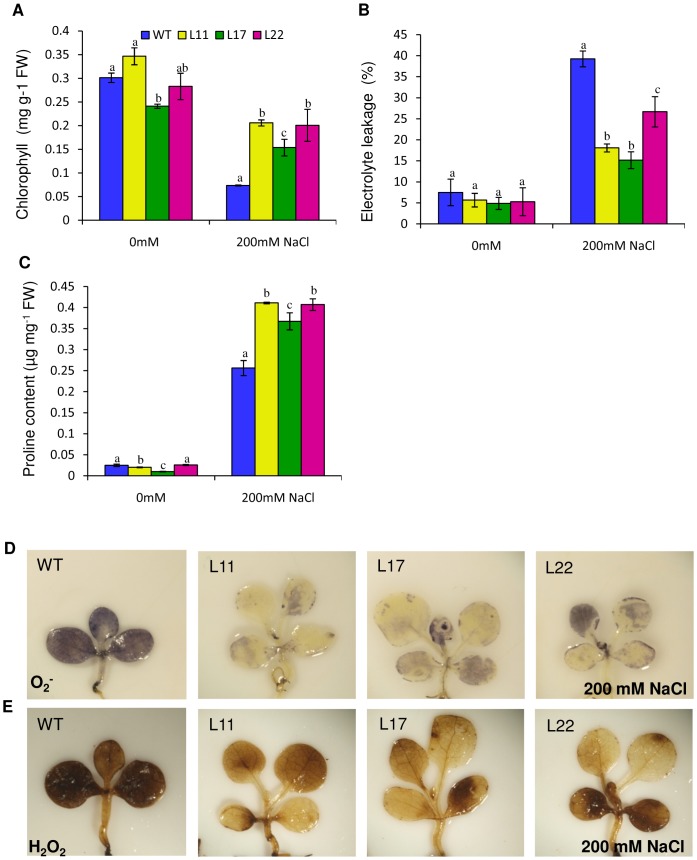
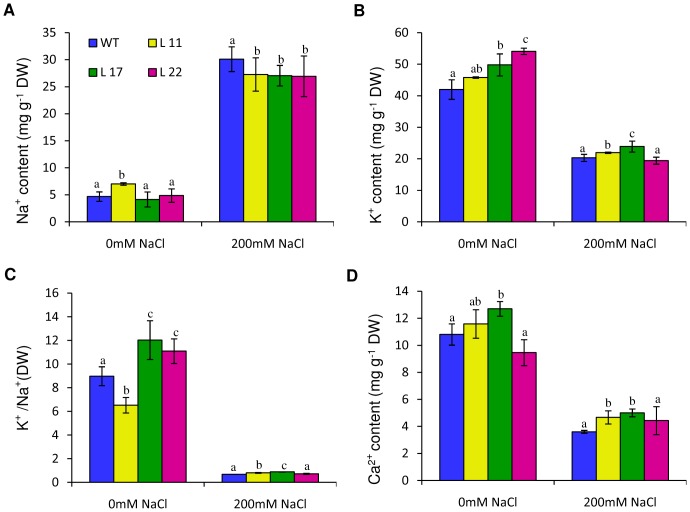
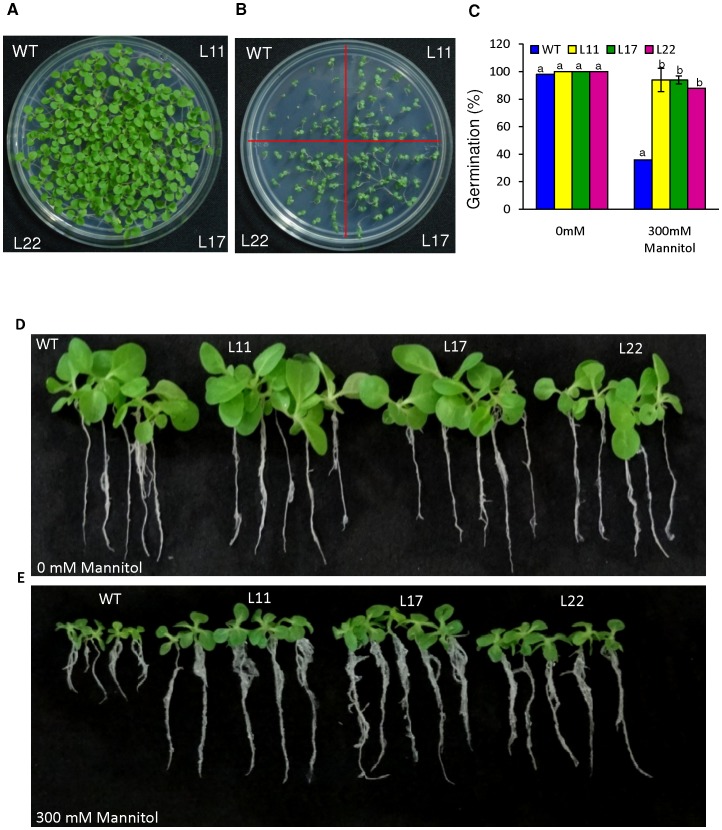
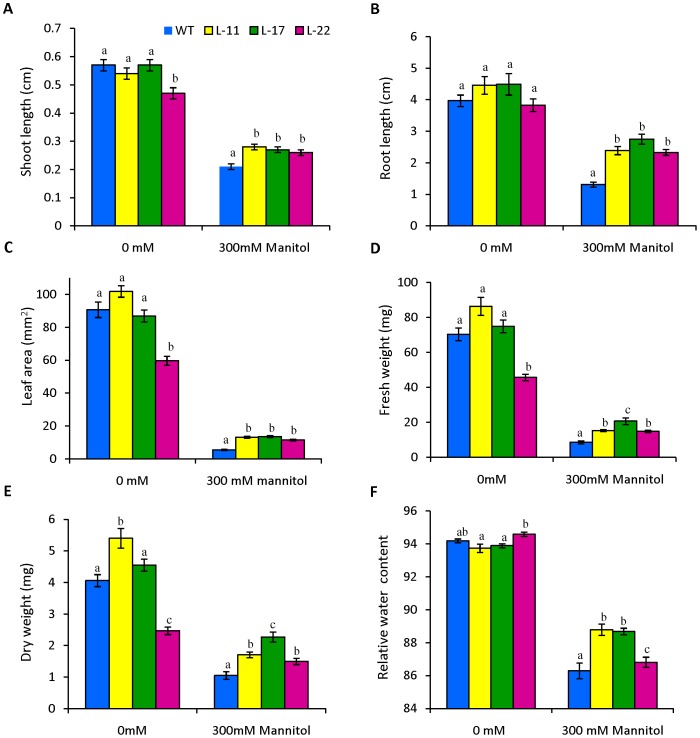
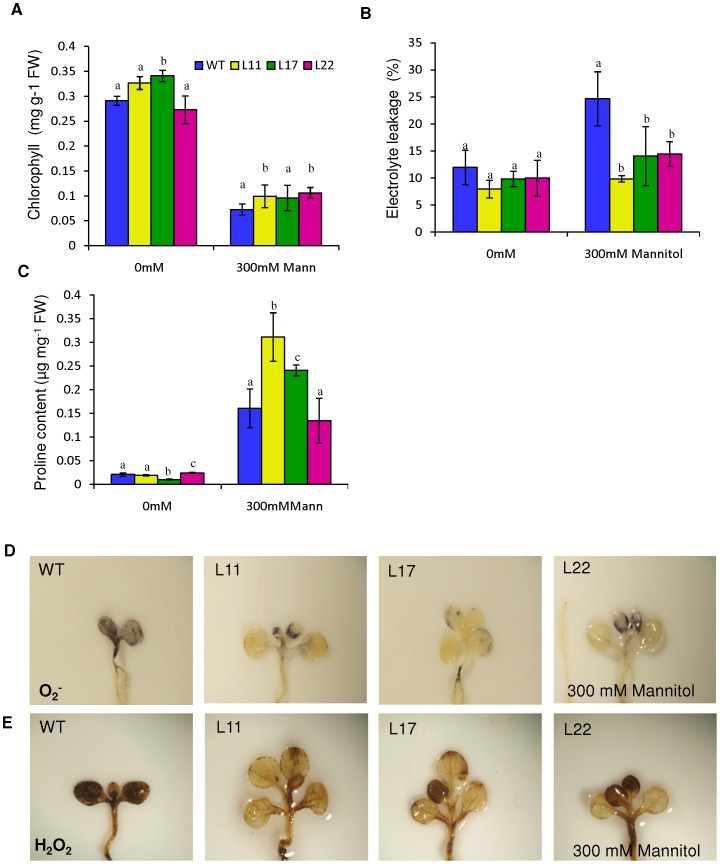
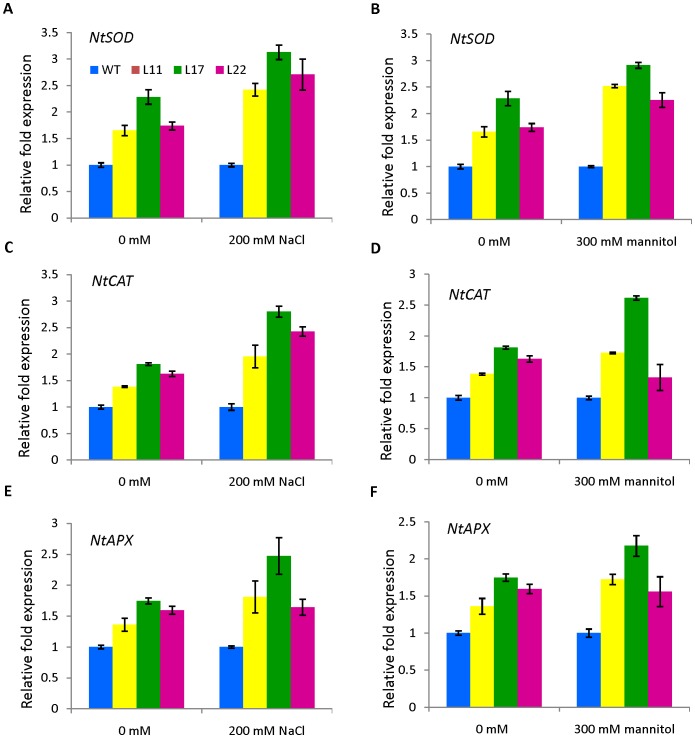
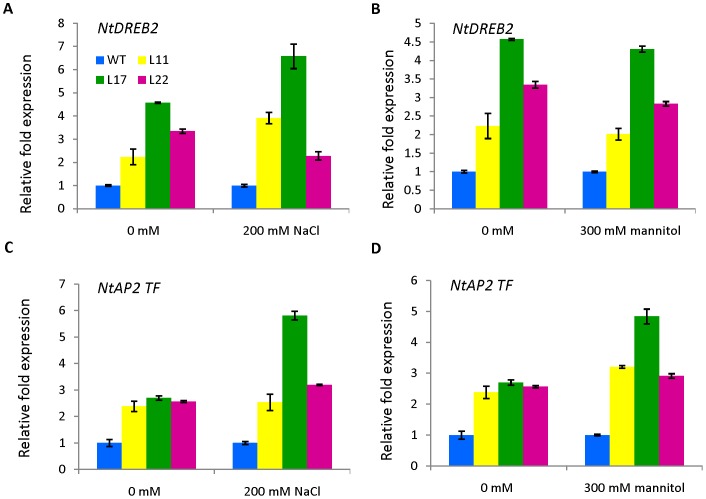
Salicornia brachiata is an extreme halophyte that grows luxuriantly in coastal marshes. Previously, we have reported isolation and characterization of ESTs from Salicornia with large number of novel/unknown salt-responsive gene sequences. In this study, we have selected a novel salt-inducible gene SbSI-2 (Salicornia brachiata salt-inducible-2) for functional characterization. Bioinformatics analysis revealed that SbSI-2 protein has predicted nuclear localization signals and a strong protein-protein interaction domain. Transient expression of the RFP:SbSI2 fusion protein confirmed that SbSI-2 is a nuclear-localized protein. Genomic organization study showed that SbSI-2 is intronless and has a single copy in Salicornia genome. Quantitative RT-PCR analysis revealed higher SbSI-2 expression under salt stress and desiccation conditions. The SbSI-2 gene was transformed in E. coli and tobacco for functional characterization. pET28a-SbSI-2 recombinant E. coli cells showed higher tolerance to desiccation and salinity compared to vector alone. Transgenic tobacco plants overexpressing SbSI-2 have improved salt- and osmotic tolerance, accompanied by better growth parameters, higher relative water content, elevated accumulation of compatible osmolytes, lower Na+ and ROS accumulation and lesser electrolyte leakage than the wild-type. Overexpression of the SbSI-2 also enhanced transcript levels of ROS-scavenging genes and some stress-related transcription factors under salt and osmotic stresses. Taken together, these results demonstrate that SbSI-2 might play an important positive modulation role in abiotic stress tolerance. This identifies SbSI-2 as a novel determinant of salt/osmotic tolerance and suggests that it could be a potential bioresource for engineering abiotic stress tolerance in crop plants.
Conflict of interest statement
Figures
Similar articles
-
A novel salt-inducible gene SbSI-1 from Salicornia brachiata confers salt and desiccation tolerance in E. coli.Mol Biol Rep. 2012 Feb;39(2):1943-8. doi: 10.1007/s11033-011-0941-9. Epub 2011 Jun 8. Mol Biol Rep. 2012. PMID: 21655957
-
Introgression of SbERD4 Gene Encodes an Early-Responsive Dehydration-Stress Protein That Confers Tolerance against Different Types of Abiotic Stresses in Transgenic Tobacco.Cells. 2021 Dec 27;11(1):62. doi: 10.3390/cells11010062. Cells. 2021. PMID: 35011624 Free PMC article.
-
Overexpression of SbSI-1, A Nuclear Protein from Salicornia brachiata Confers Drought and Salt Stress Tolerance and Maintains Photosynthetic Efficiency in Transgenic Tobacco.Front Plant Sci. 2017 Jul 13;8:1215. doi: 10.3389/fpls.2017.01215. eCollection 2017. Front Plant Sci. 2017. PMID: 28751902 Free PMC article.
-
Advances in studies on ion transporters involved in salt tolerance and breeding crop cultivars with high salt tolerance.J Zhejiang Univ Sci B. 2020 Jun;21(6):426-441. doi: 10.1631/jzus.B1900510. J Zhejiang Univ Sci B. 2020. PMID: 32478490 Free PMC article. Review.
-
Engineering salinity tolerance in plants: progress and prospects.Planta. 2020 Mar 9;251(4):76. doi: 10.1007/s00425-020-03366-6. Planta. 2020. PMID: 32152761 Review.
Cited by
-
ZmNF-YB10, a maize NF-Y transcription factor, positively regulates drought and salt stress response in Arabidopsis thaliana.GM Crops Food. 2025 Dec;16(1):28-45. doi: 10.1080/21645698.2024.2438421. Epub 2024 Dec 24. GM Crops Food. 2025. PMID: 39718137 Free PMC article.
-
Analysis of the Role of the Drought-Induced Gene DRI15 and Salinity-Induced Gene SI1 in Alternanthera philoxeroides Plasticity Using a Virus-Based Gene Silencing Tool.Front Plant Sci. 2017 Sep 12;8:1579. doi: 10.3389/fpls.2017.01579. eCollection 2017. Front Plant Sci. 2017. PMID: 28955366 Free PMC article.
-
The membrane tethered transcription factor EcbZIP17 from finger millet promotes plant growth and enhances tolerance to abiotic stresses.Sci Rep. 2018 Feb 1;8(1):2148. doi: 10.1038/s41598-018-19766-4. Sci Rep. 2018. PMID: 29391403 Free PMC article.
-
A SNARE-Like Superfamily Protein SbSLSP from the Halophyte Salicornia brachiata Confers Salt and Drought Tolerance by Maintaining Membrane Stability, K(+)/Na(+) Ratio, and Antioxidant Machinery.Front Plant Sci. 2016 Jun 2;7:737. doi: 10.3389/fpls.2016.00737. eCollection 2016. Front Plant Sci. 2016. PMID: 27313584 Free PMC article.
-
Deciphering the roles of unknown/uncharacterized genes in plant development and stress responses.Front Plant Sci. 2023 Nov 23;14:1276559. doi: 10.3389/fpls.2023.1276559. eCollection 2023. Front Plant Sci. 2023. PMID: 38078098 Free PMC article. Review.
References
-
- Mahajan S, Pandey GK, Tuteja N (2008) Calcium- and salt-stress signaling in plants: Shedding light on SOS pathway. Arch Biochem Biophys 471: 146–158. - PubMed
-
- Vinocur B, Altman A (2005) Recent advances in engineering plant tolerance to abiotic stress: achievements and limitations. Curr Opin Biotechnol 16: 123–132. - PubMed
-
- Huang GT, Ma SL, Bai LP, Zhang L, Ma H, et al. (2012) Signal transduction during cold, salt, and drought stresses in plants. Mol Biol Rep 39 2: 969–87. - PubMed
-
- Yamaguchi-Shinozaki K, Shinozaki K (2006) Transcriptional regulatory networks in cellular responses and tolerance to dehydration and cold stresses. Annu Rev Plant Biol 57: 781–803. - PubMed
-
- Hadiarto T, Tran LS (2011) Progress studies of drought-responsive genes in rice. Plant Cell Rep 30: 297–310. - PubMed
Publication types
MeSH terms
Substances
LinkOut - more resources
Full Text Sources
Other Literature Sources
