

The effect of STDP temporal kernel structure on the learning dynamics of single excitatory and inhibitory synapses
- PMID: 24999634
- PMCID: PMC4085044
- DOI: 10.1371/journal.pone.0101109
The effect of STDP temporal kernel structure on the learning dynamics of single excitatory and inhibitory synapses
Abstract
Spike-Timing Dependent Plasticity (STDP) is characterized by a wide range of temporal kernels. However, much of the theoretical work has focused on a specific kernel - the "temporally asymmetric Hebbian" learning rules. Previous studies linked excitatory STDP to positive feedback that can account for the emergence of response selectivity. Inhibitory plasticity was associated with negative feedback that can balance the excitatory and inhibitory inputs. Here we study the possible computational role of the temporal structure of the STDP. We represent the STDP as a superposition of two processes: potentiation and depression. This allows us to model a wide range of experimentally observed STDP kernels, from Hebbian to anti-Hebbian, by varying a single parameter. We investigate STDP dynamics of a single excitatory or inhibitory synapse in purely feed-forward architecture. We derive a mean-field-Fokker-Planck dynamics for the synaptic weight and analyze the effect of STDP structure on the fixed points of the mean field dynamics. We find a phase transition along the Hebbian to anti-Hebbian parameter from a phase that is characterized by a unimodal distribution of the synaptic weight, in which the STDP dynamics is governed by negative feedback, to a phase with positive feedback characterized by a bimodal distribution. The critical point of this transition depends on general properties of the STDP dynamics and not on the fine details. Namely, the dynamics is affected by the pre-post correlations only via a single number that quantifies its overlap with the STDP kernel. We find that by manipulating the STDP temporal kernel, negative feedback can be induced in excitatory synapses and positive feedback in inhibitory. Moreover, there is an exact symmetry between inhibitory and excitatory plasticity, i.e., for every STDP rule of inhibitory synapse there exists an STDP rule for excitatory synapse, such that their dynamics is identical.
Conflict of interest statement
Figures
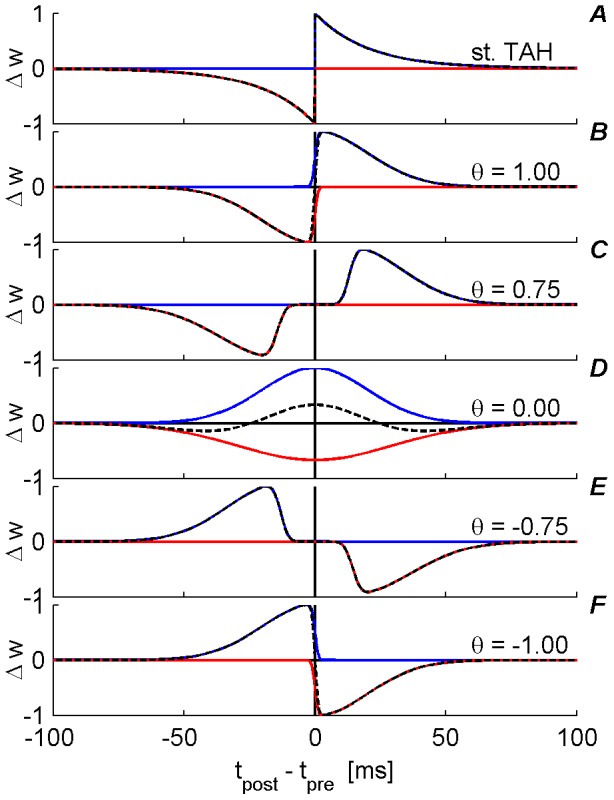
 , the red curve represents the depression branch
  and the dashed black curve represents the superposition/sum of
  . For simplicity, all plots were drawn with the same
  . (A) The “standard exponential TAH” , . (B)
  Alternate approximation to the standard exponential TAH , . (C)
  Temporally asymmetric Anti-Hebbian STDP . (D)
  TAH variation , . (E)
  Temporally symmetric Hebbian STDP , . (F)
  Variation to a temporally asymmetric Anti-Hebbian STDP
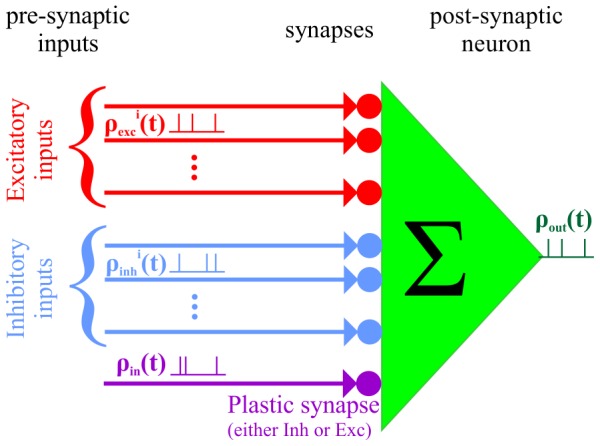
 . The synaptic weights of all synapses except one is kept fixed at a value of 0.5. The post synaptic neuron is simulated using an integrate and fire model as elaborated. See Methods for further details.
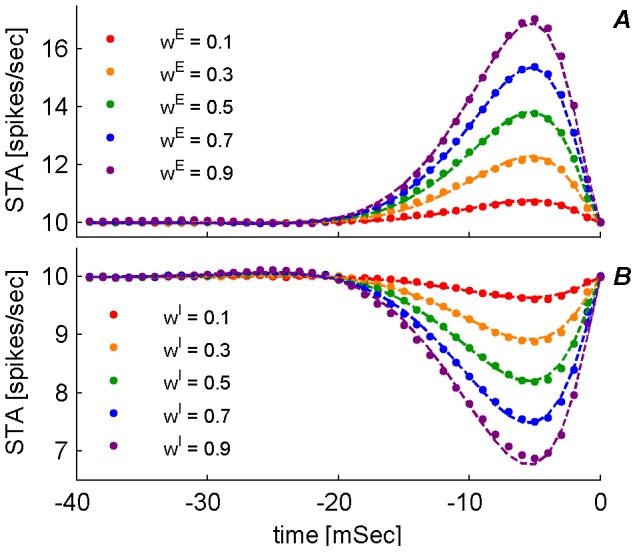
 , is plotted as function of time. (A) Excitatory synapse (B) Inhibitory synapse. Each set of dots (color coded) is the conditional mean firing rate calculated over 1000 hours of simulation time with fixed synaptic weights and presynaptic firing rates on all inputs. The different sets correspond to a different presynaptic weight (
 ) on a single synapse on which the STA was measured. The respective dashed lines show the numerical fitting of the form
  where
where  takes the revised formula:
  . For every type of synapse, i.e., excitatory (in A) and inhibitory (in B), the parameters describing
  , namely
  , were chosen to minimize the least square difference between the analytic expression and the numerical estimation of the STA. These parameters were then used to calculate
  .
.
 as defined by equations (7) and (8), with
  as set throughout the simulations, and with the fitted formula for
  .
.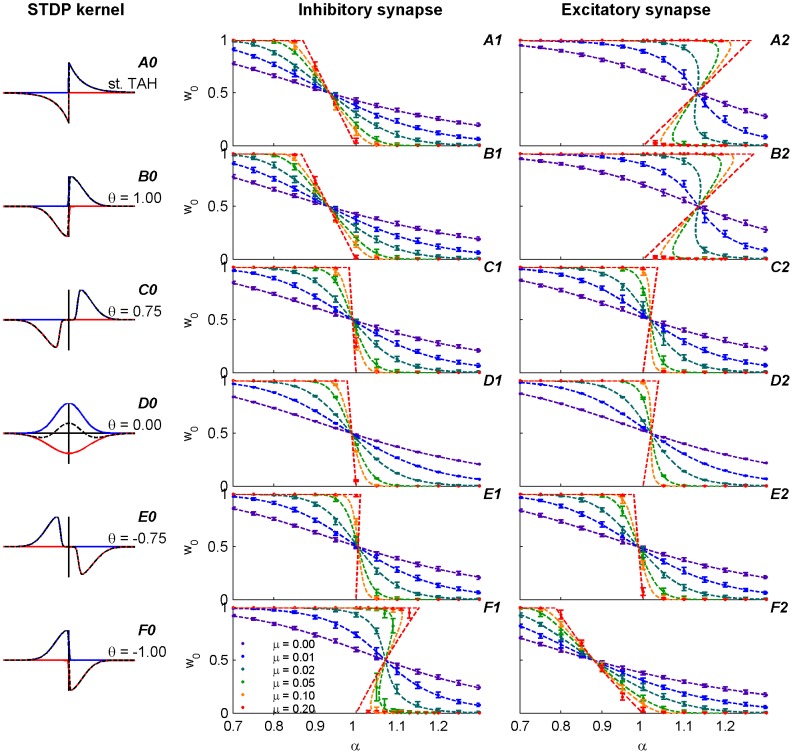
 of equations (3) and (4), for representative set of
  (shown by different colors as depicted in the legend) as a function of
  . The different rows correspond to different STDP kernels,
  as shown by the panels in the left column. The circles and error bars represent the mean and standard deviation of the synaptic weight (
 ), calculated over the trailing 50% of each learning dynamics simulation (see Methods). The mean field constants {
 } were numerically calculated using the
  constants estimated as in Figure 3. The dotted lines were computed by equation (12) that was calculated for 10,000 sequential values of
  in
in  . To this end, we replaced
  with
with  in order to use equation (12) to plot the dashed red line. Initial conditions for the simulations: for the majority of the simulations we have simply used
  as initial condition for the plastic synaptic weight. In order to show the bi-stable solutions in panels (A2, B2, F1), for
  and
and  we ran two simulations one with initial condition
  and another with initial condition
  . (A0-F0) are the STDP kernels (as in Figure 1) used in the simulations. (A1-F1) results for the inhibitory synapse simulations. (A2-F2) results for the excitatory synapse simulations.
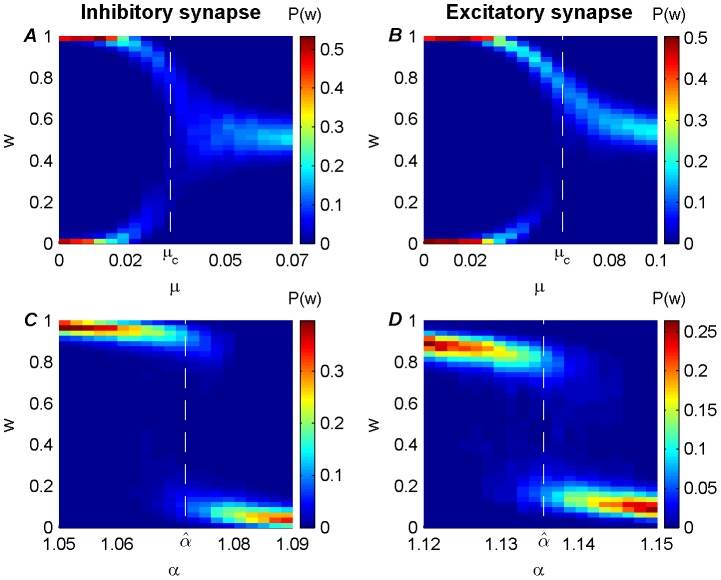
 , see also Figure 1F) rule, with fixed
  and varied
  . (B) Inhibitory synapse with anti-Hebbian (
 , see also Figure 1F) rule, with fixed
  and varied
  . (C) Excitatory synapse with Hebbian (
 , see also Figure 1B) rule, with fixed
  and varied
  . (D) Excitatory synapse with Hebbian (
 , see also Figure 1B) rule, with fixed
  and varied
  . The dashed white line marks
  in A and B, and
  in C and D.
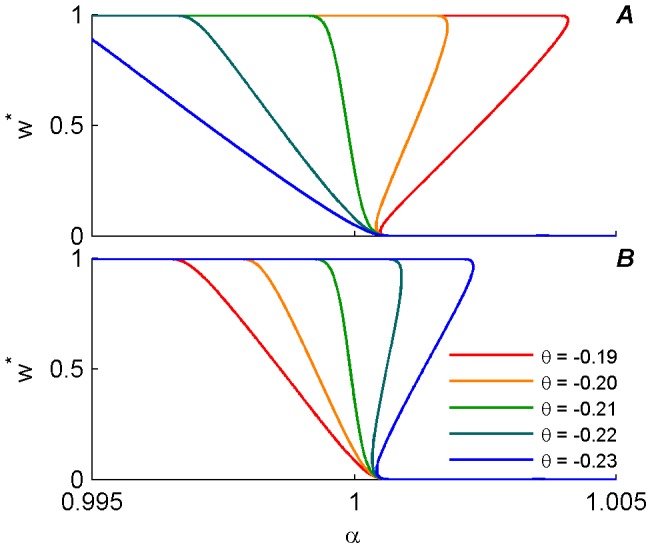
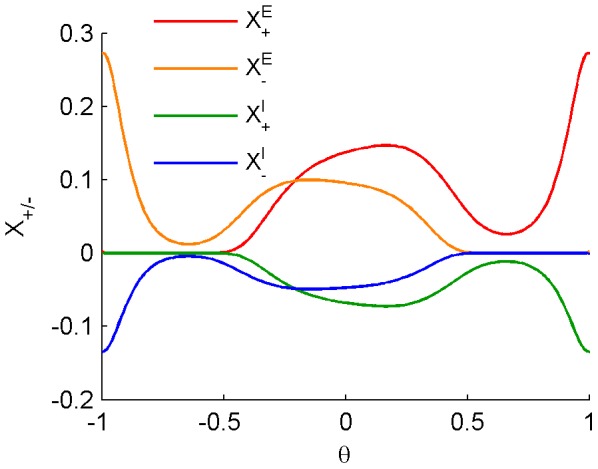
 yields continuity of the curves at the extreme values (
 and
and  ), which makes the picture clearer. On the other hand as the value of
  increases the unstable regime of
  gets smaller and the resolution for
  steps plotted should decrease. Thus, to plot these lines, we used
  which is sufficiently close to 0 to illustrate the phase transition with high accuracy in
  . (A) Excitatory synapse. (B) Inhibitory synapse
Similar articles
-
Oscillations via Spike-Timing Dependent Plasticity in a Feed-Forward Model.PLoS Comput Biol. 2016 Apr 15;12(4):e1004878. doi: 10.1371/journal.pcbi.1004878. eCollection 2016 Apr. PLoS Comput Biol. 2016. PMID: 27082118 Free PMC article.
-
Partial Breakdown of Input Specificity of STDP at Individual Synapses Promotes New Learning.J Neurosci. 2016 Aug 24;36(34):8842-55. doi: 10.1523/JNEUROSCI.0552-16.2016. J Neurosci. 2016. PMID: 27559167 Free PMC article.
-
Emergence and maintenance of modularity in neural networks with Hebbian and anti-Hebbian inhibitory STDP.PLoS Comput Biol. 2025 Apr 22;21(4):e1012973. doi: 10.1371/journal.pcbi.1012973. eCollection 2025 Apr. PLoS Comput Biol. 2025. PMID: 40262082 Free PMC article.
-
Spike timing-dependent plasticity: a Hebbian learning rule.Annu Rev Neurosci. 2008;31:25-46. doi: 10.1146/annurev.neuro.31.060407.125639. Annu Rev Neurosci. 2008. PMID: 18275283 Review.
-
A Hypothetical Model Concerning How Spike-Timing-Dependent Plasticity Contributes to Neural Circuit Formation and Initiation of the Critical Period in Barrel Cortex.J Neurosci. 2019 May 15;39(20):3784-3791. doi: 10.1523/JNEUROSCI.1684-18.2019. Epub 2019 Mar 15. J Neurosci. 2019. PMID: 30877173 Free PMC article. Review.
Cited by
-
Oscillations via Spike-Timing Dependent Plasticity in a Feed-Forward Model.PLoS Comput Biol. 2016 Apr 15;12(4):e1004878. doi: 10.1371/journal.pcbi.1004878. eCollection 2016 Apr. PLoS Comput Biol. 2016. PMID: 27082118 Free PMC article.
-
Timing-dependent LTP and LTD in mouse primary visual cortex following different visual deprivation models.PLoS One. 2017 May 17;12(5):e0176603. doi: 10.1371/journal.pone.0176603. eCollection 2017. PLoS One. 2017. PMID: 28520739 Free PMC article.
-
STDP and the distribution of preferred phases in the whisker system.PLoS Comput Biol. 2021 Sep 17;17(9):e1009353. doi: 10.1371/journal.pcbi.1009353. eCollection 2021 Sep. PLoS Comput Biol. 2021. PMID: 34534208 Free PMC article.
-
Recall tempo of Hebbian sequences depends on the interplay of Hebbian kernel with tutor signal timing.Proc Natl Acad Sci U S A. 2024 Aug 6;121(32):e2309876121. doi: 10.1073/pnas.2309876121. Epub 2024 Jul 30. Proc Natl Acad Sci U S A. 2024. PMID: 39078676 Free PMC article.
-
Multiplexing rhythmic information by spike timing dependent plasticity.PLoS Comput Biol. 2020 Jun 29;16(6):e1008000. doi: 10.1371/journal.pcbi.1008000. eCollection 2020 Jun. PLoS Comput Biol. 2020. PMID: 32598350 Free PMC article.
References
-
- Feldman DE (2000) Timing-based LTP and LTD at vertical inputs to layer II/III pyramidal cells in rat barrel cortex. Neuron 27: 45–56. - PubMed
-
- Sjostrom PJ, Turrigiano GG, Nelson SB (2001) Rate, timing, and cooperativity jointly determine cortical synaptic plasticity. Neuron 32: 1149–1164. - PubMed
-
- Song S, Miller KD, Abbott LF (2000) Competitive Hebbian learning through spike-timing-dependent synaptic plasticity. Nature Neuroscience 3: 919–926. - PubMed
Publication types
MeSH terms
LinkOut - more resources
Full Text Sources
Other Literature Sources
