

Urokinase plasminogen activator receptor (uPAR) and plasminogen activator inhibitor-1 (PAI-1) are potential predictive biomarkers in early stage oral squamous cell carcinomas (OSCC)
- PMID: 24999729
- PMCID: PMC4084992
- DOI: 10.1371/journal.pone.0101895
Urokinase plasminogen activator receptor (uPAR) and plasminogen activator inhibitor-1 (PAI-1) are potential predictive biomarkers in early stage oral squamous cell carcinomas (OSCC)
Abstract
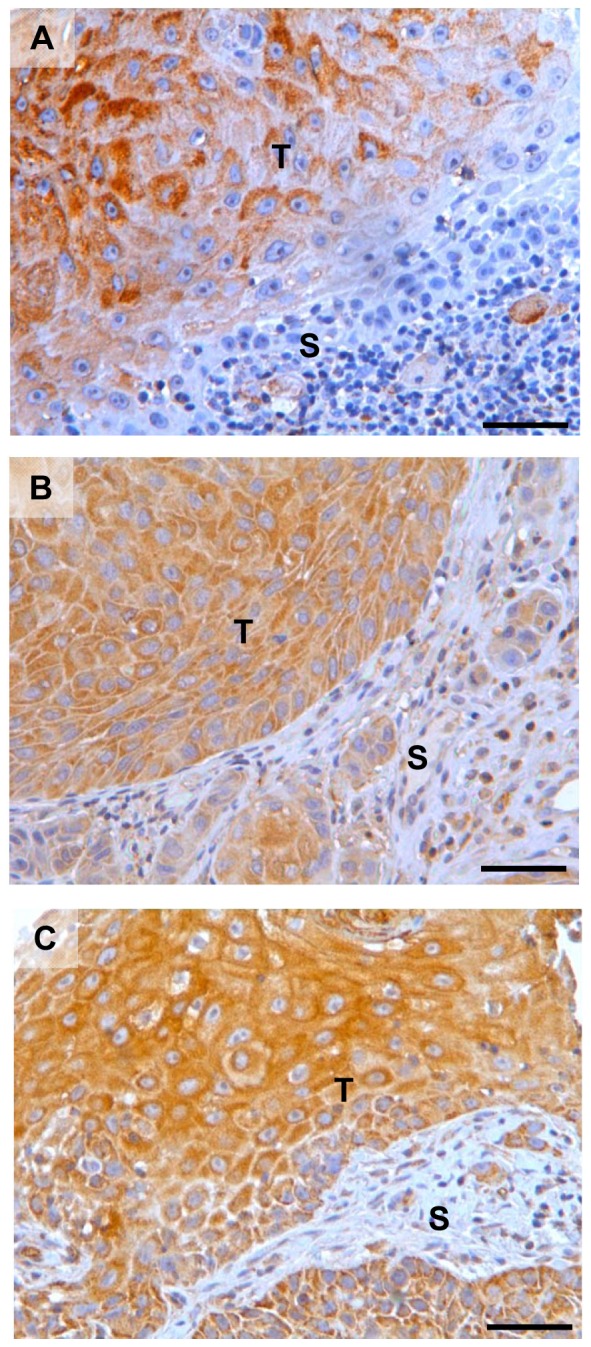
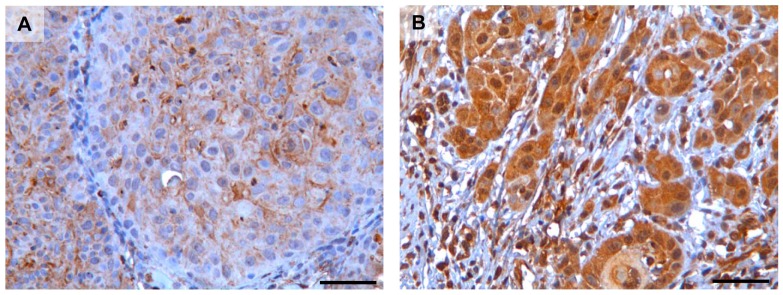
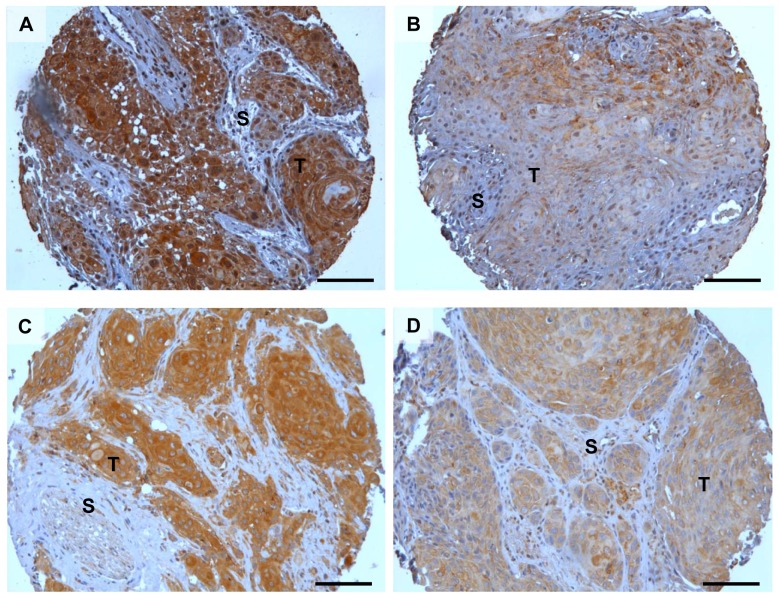
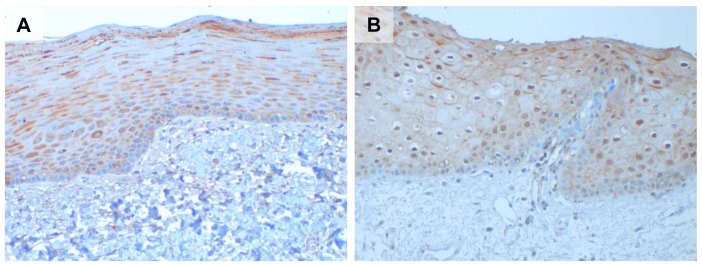
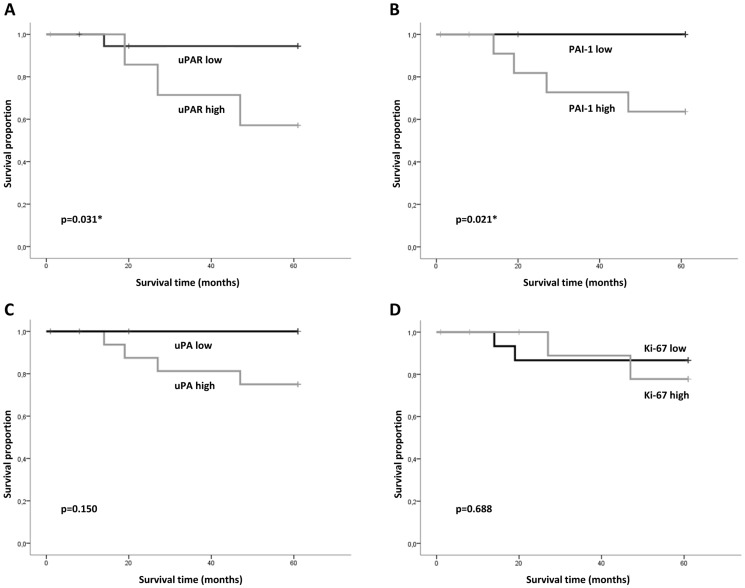
Oral squamous cell carcinoma (OSCC) is often associated with metastatic disease and a poor 5 year survival rate. Patients diagnosed with small tumours generally have a more favourable outcome, but some of these small tumours are aggressive and lead to early death. To avoid harmful overtreatment of patients with favourable prognosis, there is a need for predictive biomarkers that can be used for treatment stratification. In this study we assessed the possibility to use components of the plasminogen activator (PA) system as prognostic markers for OSCC outcome and compared this to the commonly used biomarker Ki-67. A tissue-micro-array (TMA) based immunohistochemical analysis of primary tumour tissue obtained from a North Norwegian cohort of 115 patients diagnosed with OSCC was conducted. The expression of the biomarkers was compared with clinicopathological variables and disease specific death. The statistical analyses revealed that low expression of uPAR (p = 0.031) and PAI-1 (p = 0.021) in the tumour cells was significantly associated with low disease specific death in patients with small tumours and no lymph node metastasis (T1N0). The commonly used biomarker, Ki-67, was not associated with disease specific death in any of the groups of patients analysed. The conclusion is that uPAR and PAI-1 are potential predictive biomarkers in early stage tumours and that this warrants further studies on a larger cohort of patients.
Conflict of interest statement
Figures
Similar articles
-
Expression of urokinase-type plasminogen activator/urokinase-type plasminogen activator receptor and maspin in oral squamous cell carcinoma: Association with mode of invasion and clinicopathological factors.Oncol Rep. 2011 Dec;26(6):1555-60. doi: 10.3892/or.2011.1419. Epub 2011 Aug 10. Oncol Rep. 2011. PMID: 21833477
-
Prognostic value analysis of urokinase-type plasminogen activator receptor in oral squamous cell carcinoma: an immunohistochemical study.BMC Cancer. 2008 Aug 1;8:220. doi: 10.1186/1471-2407-8-220. BMC Cancer. 2008. PMID: 18673553 Free PMC article.
-
Plasminogen activator system in oral squamous cell carcinoma.Br J Oral Maxillofac Surg. 2007 Dec;45(8):623-7. doi: 10.1016/j.bjoms.2007.04.021. Epub 2007 Jun 21. Br J Oral Maxillofac Surg. 2007. PMID: 17590247
-
uPA/uPAR and SERPINE1 in head and neck cancer: role in tumor resistance, metastasis, prognosis and therapy.Oncotarget. 2016 Aug 30;7(35):57351-57366. doi: 10.18632/oncotarget.10344. Oncotarget. 2016. PMID: 27385000 Free PMC article. Review.
-
Urinary-type plasminogen activator (uPA) and its receptor (uPAR) in squamous cell carcinoma of the oral cavity.Biochem J. 2007 Oct 15;407(2):153-9. doi: 10.1042/BJ20071037. Biochem J. 2007. PMID: 17880283 Review.
Cited by
-
Urokinase-type plasminogen activator receptor (uPAR), tissue factor (TF) and epidermal growth factor receptor (EGFR): tumor expression patterns and prognostic value in oral cancer.BMC Cancer. 2017 Aug 25;17(1):572. doi: 10.1186/s12885-017-3563-3. BMC Cancer. 2017. PMID: 28841839 Free PMC article.
-
Association of SNPs in the PAI1 Gene with Disease Recurrence and Clinical Outcome in Bladder Cancer.Int J Mol Sci. 2023 Mar 3;24(5):4943. doi: 10.3390/ijms24054943. Int J Mol Sci. 2023. PMID: 36902377 Free PMC article.
-
Plectin as a prognostic marker in non-metastatic oral squamous cell carcinoma.BMC Oral Health. 2015 Aug 26;15:98. doi: 10.1186/s12903-015-0084-9. BMC Oral Health. 2015. PMID: 26306491 Free PMC article.
-
Enhanced cell migration and apoptosis resistance may underlie the association between high SERPINE1 expression and poor outcome in head and neck carcinoma patients.Oncotarget. 2015 Oct 6;6(30):29016-33. doi: 10.18632/oncotarget.5032. Oncotarget. 2015. PMID: 26359694 Free PMC article.
-
(68)Ga-DOTATOC PET and gene expression profile in patients with neuroendocrine carcinomas: strong correlation between PET tracer uptake and gene expression of somatostatin receptor subtype 2.Am J Nucl Med Mol Imaging. 2016 Jan 28;6(1):59-72. eCollection 2016. Am J Nucl Med Mol Imaging. 2016. PMID: 27069766 Free PMC article.
References
-
- IARC (2005) Oral cavity and oropharynx. In: Barnes L, Eveson, J.W., Reichart, P., Sidransky, D., editor. World Health Organization Classification of Tumors, Pathology and Genetics of Head and Neck Tumours. Lyon: World Health Organization. pp. 163–208.
-
- Leemans CR, Braakhuis BJ, Brakenhoff RH (2011) The molecular biology of head and neck cancer. Nat Rev Cancer 11: 9–22. - PubMed
-
- Mao L, Hong WK, Papadimitrakopoulou VA (2004) Focus on head and neck cancer. Cancer Cell 5: 311–316. - PubMed
-
- Massano J, Regateiro FS, Januario G, Ferreira A (2006) Oral squamous cell carcinoma: review of prognostic and predictive factors. Oral Surg Oral Med Oral Pathol Oral Radiol Endod 102: 67–76. - PubMed
-
- Oliveira LR, Ribeiro-Silva A (2011) Prognostic significance of immunohistochemical biomarkers in oral squamous cell carcinoma. Int J Oral Maxillofac Surg 40: 298–307. - PubMed
Publication types
MeSH terms
Substances
LinkOut - more resources
Full Text Sources
Other Literature Sources
Medical
Miscellaneous
