Comparative Study
. 2014 Jul 7:5:3963.
doi: 10.1038/ncomms4963.

The Pan-Cancer analysis of pseudogene expression reveals biologically and clinically relevant tumour subtypes

Affiliations
Comparative Study

The Pan-Cancer analysis of pseudogene expression reveals biologically and clinically relevant tumour subtypes

Leng Han et al. Nat Commun. .

Abstract

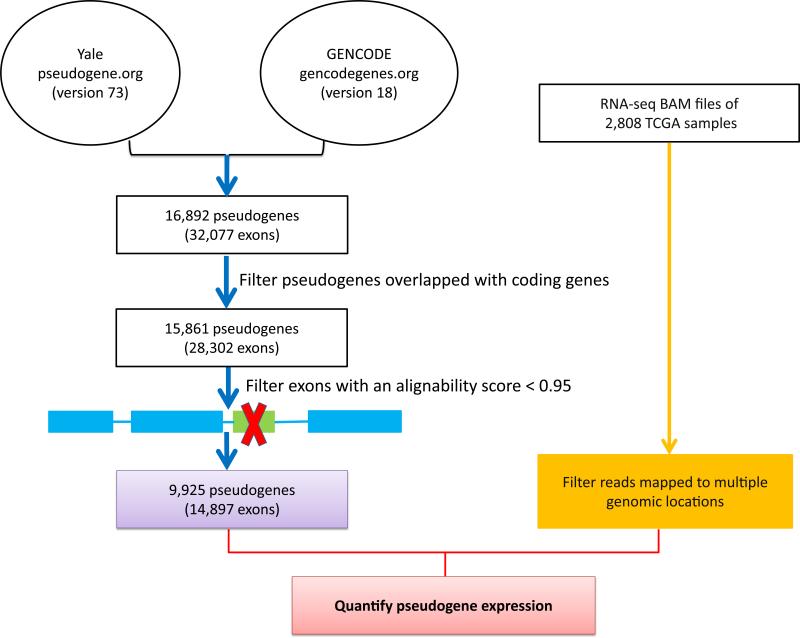
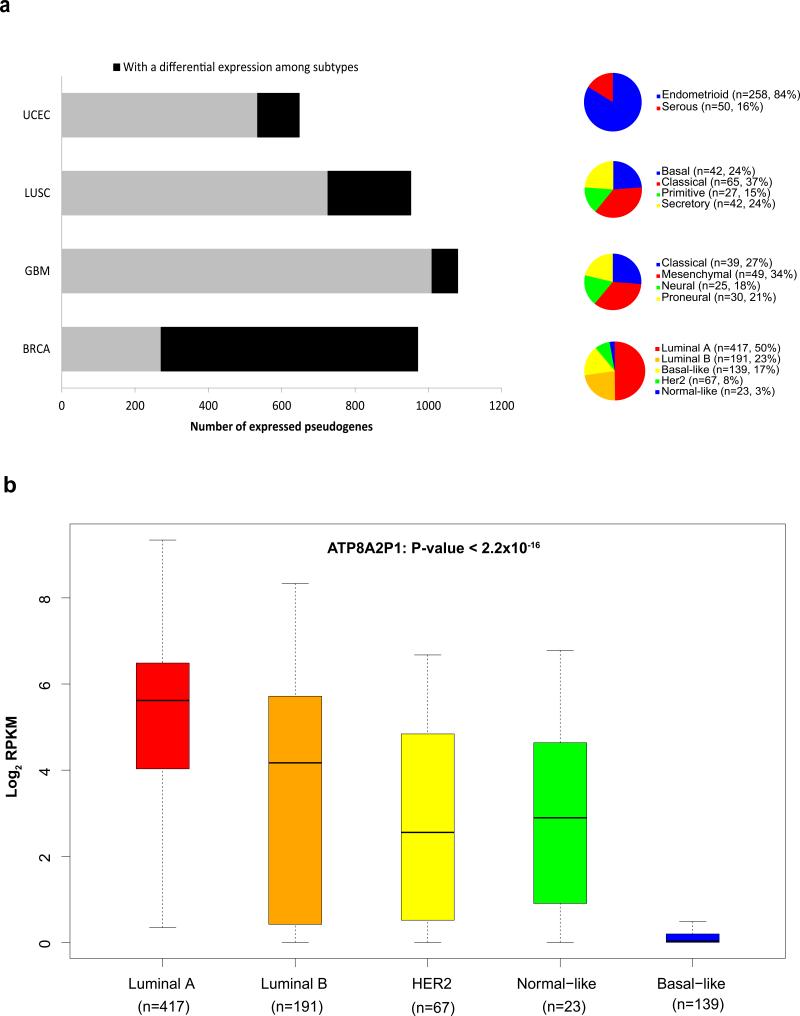
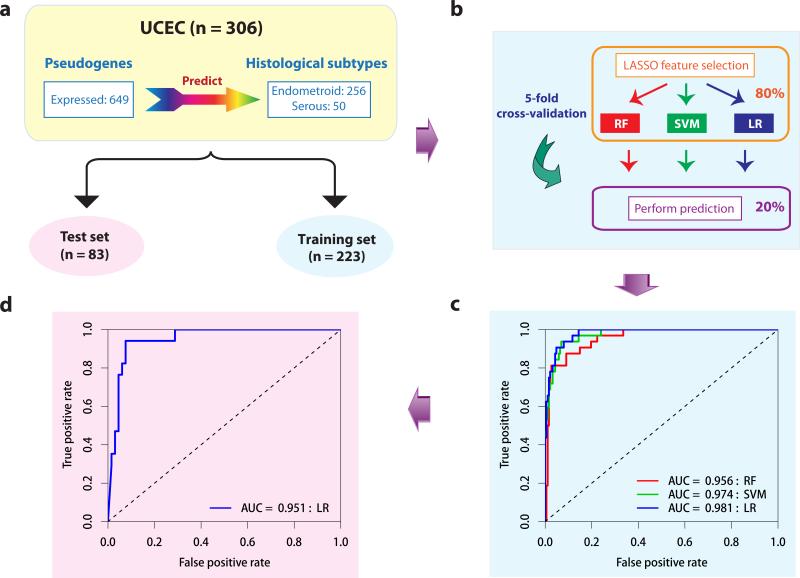
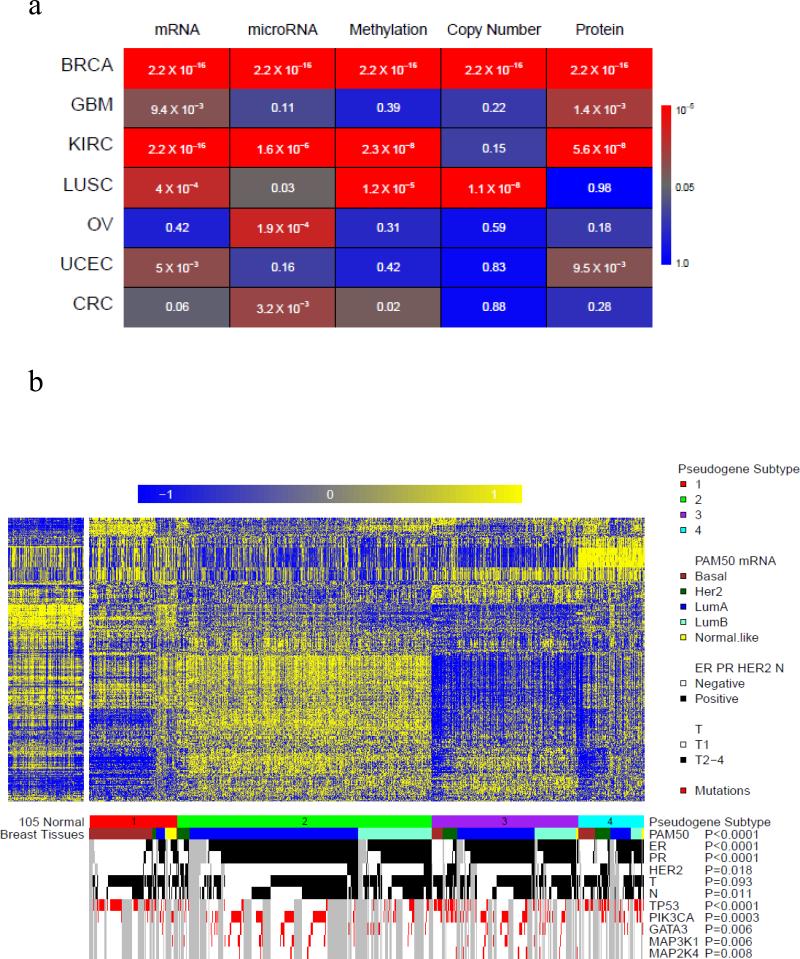
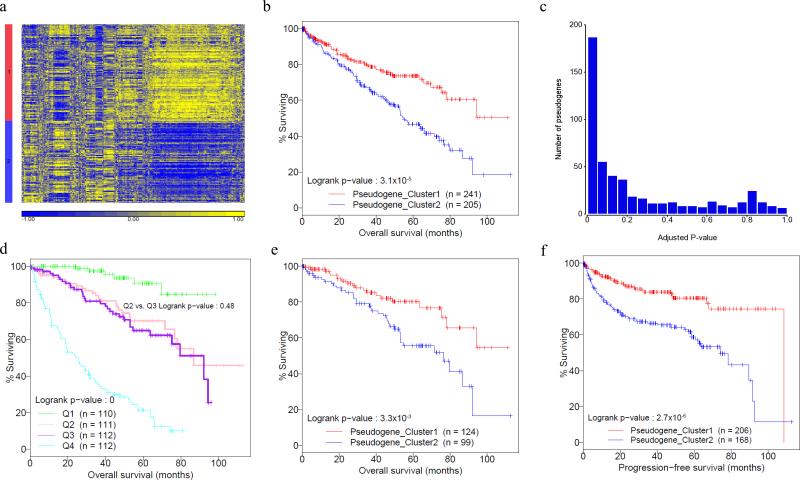
Although individual pseudogenes have been implicated in tumour biology, the biomedical significance and clinical relevance of pseudogene expression have not been assessed in a systematic way. Here we generate pseudogene expression profiles in 2,808 patient samples of seven cancer types from The Cancer Genome Atlas RNA-seq data using a newly developed computational pipeline. Supervised analysis reveals a significant number of pseudogenes differentially expressed among established tumour subtypes and pseudogene expression alone can accurately classify the major histological subtypes of endometrial cancer. Across cancer types, the tumour subtypes revealed by pseudogene expression show extensive and strong concordance with the subtypes defined by other molecular data. Strikingly, in kidney cancer, the pseudogene expression subtypes not only significantly correlate with patient survival, but also help stratify patients in combination with clinical variables. Our study highlights the potential of pseudogene expression analysis as a new paradigm for investigating cancer mechanisms and discovering prognostic biomarkers.


Figures

Figure 1
Figure 1. A computational pipeline to quantify the expression of pseudogenes from TCGA RNA-seq data
First, we combined the latest pseudogene annotations from the Yale Pseudogene database and the GENCODE Pseudogene Resource and filtered those pseudogenes that overlapped with any known protein-coding genes. Second, we evaluated the sequence uniqueness of each exon of a pseudogene, and only retained those pseudogenes containing exon(s) with sufficient alignability for further characterization. Third, we filtered those reads mapped to multiple genomic locations from TCGA BAM files.
Figure 2
Figure 2. Identification of differentially expressed pseudogenes among established tumor subtypes
(a) Numbers of significantly differentially expressed pseudogenes in multiple cancer types. For each cancer type, the whole bar represents the number of expressed pseudogenes (mean RPKM≥0.3) in the analysis; the black part represents the number of expressed pseudogenes with a detected significance for differential expression among tumor subtypes (t-test or single-factor ANOVA, corrected P < 0.05); and the pie chart shows the sample numbers and percentages in each cancer type. (b) The box plot for the expression pattern of ATP8A2P1 in 837 BRCA samples based on PAM50 subtypes: luminal A (n = 417), luminal B (n = 191), basal-like (n = 139), Her2-enriched (n = 67), and normal-like (n = 23). The boxes show the median ± 1 quartile, with whiskers extending to the most extreme data point within 1.5 interquartile range from the box boundaries.
Figure 3
Figure 3. The predictive power of pseudogene expression in classification of UCEC subtypes
(a) The UCEC dataset (n = 306) was split into training (n = 223) and test (n = 83) sets. (b) Schematic representation of feature selection and classifiers building through five-fold cross-validation within the training set. (c) The ROC curves of the three classifiers based on the cross-validation within the training set. (d) The ROC curve from applying the best-performing classifier (LR) built from the whole training set to the test set. (RF: random forest, SVM: support vector machine, LR: logistic regression.)
Figure 4
Figure 4. Correlations of pseudogene expression subtypes with other tumor subtypes
(a) Concordance between pseudogene expression subtypes and molecular subtypes defined by other genomic data in seven TCGA cancer types. Pseudogene-expression subtypes were defined based on the expression of 500 or 100 pseudogenes with the most variable patterns through unsupervised analysis using non-negative matrix factorization (NMF). The colors indicate the statistical significance of the chi-squared tests for assessing the concordance between the pseudogene-expression subtypes and other molecular subtypes. (b) Concordance between pseudogene expression subtypes and other subtypes in BRCA. Pseudogene expression: subtype 1, red (n = 144); subtype 2, green (n = 390); and subtype 3, purple (n = 303). PAM50 subtypes: basal-like (brown), HER2-enriched (dark green), luminal A (blue), luminal B (aquamarine), and normal-like (yellow). The status of ER, PR, HER2 or N is marked in black (positive) and white (negative); T status is marked in black (T2-T4) and white (T1). Mutations of TP53, PIK3CA, GATA3, MAP3K1, and MAP2K4 are marked in red. Correlations were assessed by chi-squared tests.
Figure 5
Figure 5. Prognostic value of pseudogene expression in KIRC
(a) KIRC subtypes are classified based on the expression of 500 pseudogenes with the most variable patterns through unsupervised analysis using non-negative matrix factorization (NMF, n = 446). (b) Kaplan-Meier plot showing correlations of the two pseudogene expression subtypes with overall survival (log-rank test P = 0.019). Red denotes pseudogene expression subtype 1 (n = 241); blue denotes pseudogene-expression subtype 2 (n = 205). (c) P-value distribution of individual pseudogene expressions in multivariate Cox proportional hazards model containing clinical variables. (d) Kaplan-Meier plot of the four risk groups defined by clinical variables in terms of overall survival, and the two middle risk groups cannot be separated (Q2 [n = 111] vs. Q3 [n =112], log-rank test P = 0.48). (e) Kaplan-Meier plot showing that the two pseudogene expression subtypes can effectively separate the samples in the two medium risk groups in terms of overall survival (Q2 [n = 113] vs. Q3 [n = 110], log-rank test P = 9.6×10⁻³).

Comment in

References

    1. Balakirev ES, Ayala FJ. Pseudogenes: are they “junk” or functional DNA? Annu. Rev. Genet. 2003;37:123–51. - PubMed
    1. Pei B, et al. The GENCODE pseudogene resource. Genome Biol. 2012;13:R51. - PMC - PubMed
    1. Li WH, Gojobori T, Nei M. Pseudogenes as a paradigm of neutral evolution. Nature. 1981;292:237–9. - PubMed
    1. Pink RC, et al. Pseudogenes: pseudo-functional or key regulators in health and disease? RNA. 2011;17:792–8. - PMC - PubMed
    1. Poliseno L. Pseudogenes: newly discovered players in human cancer. Sci. Signal. 2012;5:re5. - PubMed

Publication types

Substances