. 2014 Jul 7;9(7):e101298.
doi: 10.1371/journal.pone.0101298. eCollection 2014.

Life cycle assessment of metals: a scientific synthesis

Affiliations

Life cycle assessment of metals: a scientific synthesis

Philip Nuss et al. PLoS One. .

Abstract

We have assembled extensive information on the cradle-to-gate environmental burdens of 63 metals in their major use forms, and illustrated the interconnectedness of metal production systems. Related cumulative energy use, global warming potential, human health implications and ecosystem damage are estimated by metal life cycle stage (i.e., mining, purification, and refining). For some elements, these are the first life cycle estimates of environmental impacts reported in the literature. We show that, if compared on a per kilogram basis, the platinum group metals and gold display the highest environmental burdens, while many of the major industrial metals (e.g., iron, manganese, titanium) are found at the lower end of the environmental impacts scale. If compared on the basis of their global annual production in 2008, iron and aluminum display the largest impacts, and thallium and tellurium the lowest. With the exception of a few metals, environmental impacts of the majority of elements are dominated by the purification and refining stages in which metals are transformed from a concentrate into their metallic form. Out of the 63 metals investigated, 42 metals are obtained as co-products in multi output processes. We test the sensitivity of varying allocation rationales, in which the environmental burden are allocated to the various metal and mineral products, on the overall results. Monte-Carlo simulation is applied to further investigate the stability of our results. This analysis is the most comprehensive life cycle comparison of metals to date and allows for the first time a complete bottom-up estimate of life cycle impacts of the metals and mining sector globally. We estimate global direct and indirect greenhouse gas emissions in 2008 at 3.4 Gt CO2-eq per year and primary energy use at 49 EJ per year (9.5% of global use), and report the shares for all metals to both impact categories.


Conflict of interest statement

Competing Interests: The authors have declared that no competing interests exist.

Figures

Figure 1
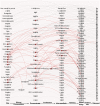
Figure 1. Diagram of the cradle-to-gate production of the minerals and metals (starting with ores from the left) analyzed in this study, in order of atomic number.
Nodes representing mineral and metal products and intermediates, and the edges (arrows) indicating the physical transformation of metals via industrial processes from one chemical form (material) into another. Nodes and edges in red color represent joint production and illustrate the interconnectedness of the metals production system. Although not a metal, helium is includes in the assessment as it is sometimes regarded as a critical element required for the cooling of nuclear power plants. The figure was created using Gephi v0.8.2 .
Figure 2
Figure 2. Periodic table of global warming potentials (GWPs).
(A) The cradle-to-gate GWP per kilogram of each element (kg CO2-eq per kg) colored according to the color ramp above. GWPs shown are weighted by the 2008 supply mix for each element (see Table S38 in Supporting Information S1). (B) Illustration of the Pb-Zn system as an example of a joint production scheme (red color) from which Ge, Ag, Cd, In, Tl, and Bi are recovered as co- or by-products. (C) Uncertainty estimates (95% confidence interval) for the elements of the Pb-Zn system were derived using Monte-Carlo analysis.
Figure 3
Figure 3. Periodic table of environmental impacts (colored according to the color ramp above).
(A) Cradle-to-gate cumulative energy demand (CED) (MJ-eq/kg) per kilogram of each element. aCumulative energy demand for Th and U does not include non-renewable nuclear energy demand of U and Th in ground. (B) Cradle-to-gate terrestrial acidification (kg SO2-eq/kg). (C) Cradle-to-gate freshwater eutrophication (kg P-eq/kg). (D) Cradle-to-gate human toxicity (cancer and non-cancer) (CTUh/kg). Impacts to acidification and eutrophication were derived using the ReCiPe Midpoint method 1.08 H/H for the globe . Human toxicity was calculated using the USETox v1.02. method with recommended and interim characterization factors .
Figure 4
Figure 4. Relative environmental implications by life cycle stage.
Only materials for which data for more than one life cycle stage was available are shown. Due to the aggregated nature of many of the data sets, in some instances the figure includes cumulative contributions from two life cycle stages (see legend). aThe human health implications (DALY/kg) and ecosystem damage (species.yr/kg) were calculated using the World ReCiPe Endpoint (H) impact assessment method v1.08 . They represent potential damages prior to normalization and weighting. *The relative breakdown of the environmental burden of Y2O3 production is similar to other rare earths (i.e., La, Ce, Pr, Nd, Sm, Eu, Gd, Tb, Dy, Ho, Er, Tm, Yb, and Lu), which are therefore not shown in this figure. ** The breakdown of the environmental burden of Ru production is similar to other platinum group metals (i.e., Rh, Pd, Os, Ir, and Pt) from primary ore, which are therefore not shown in this figure. FeCr =  Ferrochromium. FeMn =  Ferromanganese. FeNb =  Ferroniobium. Elements in brackets indicate the host metal from which the metal is obtained as a co-product. SE =  Sweden.
Figure 5
Figure 5. Global annual environmental implications of metals production in 2008.
Per-kilogram impacts were multiplied with their respective production figures for year 2008 from USGS Mineral Yearbooks . The cradle-to-gate human health and ecosystem damage (Pt/yr) were derived using the ReCiPe Endpoint method 1.08 H/H for the globe .
Figure 6
Figure 6. Breakdown of Global CO2 Emissions and Cumulative Energy Demand Per Metal in 2008.
Figure 7
Figure 7. Choice of allocation rationale and implications on metals environmental burdens.

References

    1. Greenfield A, Graedel TE (2013) The omnivorous diet of modern technology. Resour Conserv Recycl 74: : 1–7. Available: http://www.sciencedirect.com/science/article/pii/S0921344913000396. Accessed 29 October 2013.
    1. Graedel TE, Erdmann L (2012) Will metal scarcity impede routine industrial use? MRS Bull 37: 325–331 10.1557/mrs.2012.34 - DOI
    1. Van der Voet E, Salminen R, Eckelman M, Mudd G, Norgate T, et al... (2013) Environmental Risks and Challenges of Anthropogenic Metals Flows and Cycles. A Report of the Working Group on the Global Metal Flows to the International Resource Panel. United Nations Environment Programme (UNEP).
    1. Kleijn R, van der Voet E, Kramer GJ, van Oers L, van der Giesen C (2011) Metal requirements of low-carbon power generation. Energy 36: : 5640–5648. Available: http://www.sciencedirect.com/science/article/pii/S0360544211004518. Accessed 24 July 2013.
    1. Elshkaki A, Graedel TE (2013) Dynamic analysis of the global metals flows and stocks in electricity generation technologies. J Clean Prod. Available: http://www.sciencedirect.com/science/article/pii/S0959652613004575. Accessed 24 July 2013.

Publication types