. 2014 Jul 7:5:4330.
doi: 10.1038/ncomms5330.

Modelling Fanconi anemia pathogenesis and therapeutics using integration-free patient-derived iPSCs

Affiliations

Modelling Fanconi anemia pathogenesis and therapeutics using integration-free patient-derived iPSCs

Guang-Hui Liu et al. Nat Commun. .

Abstract

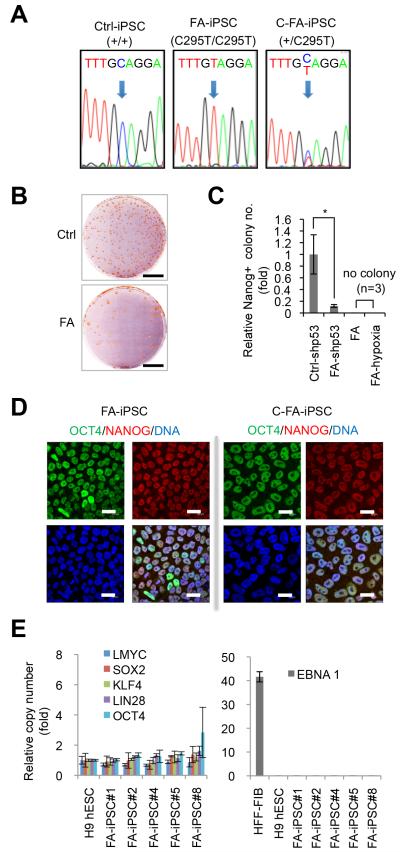
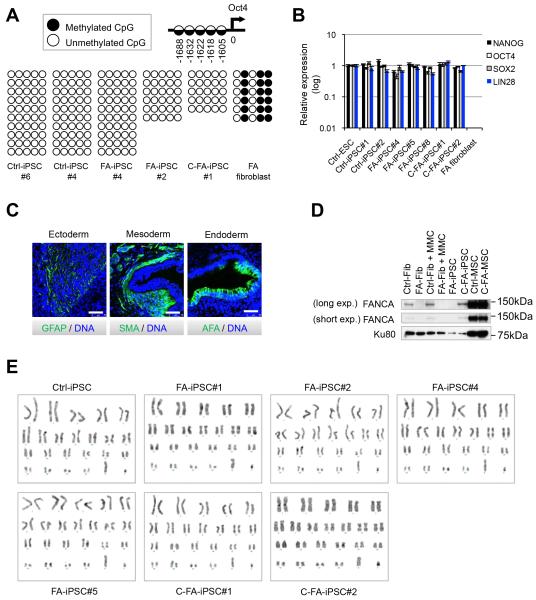
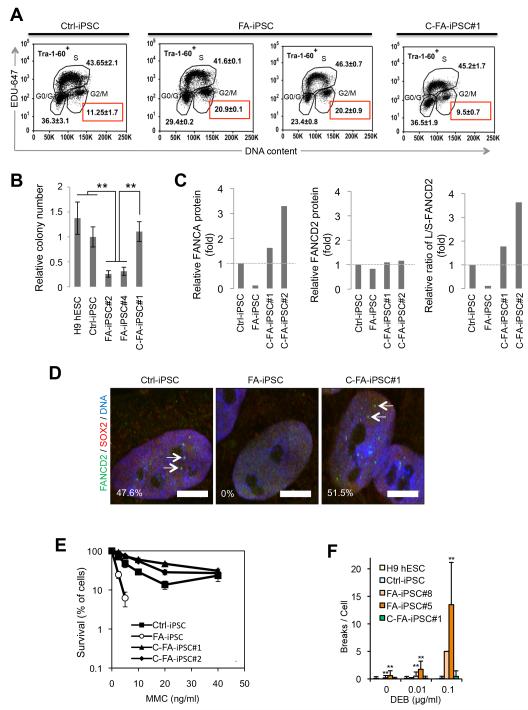
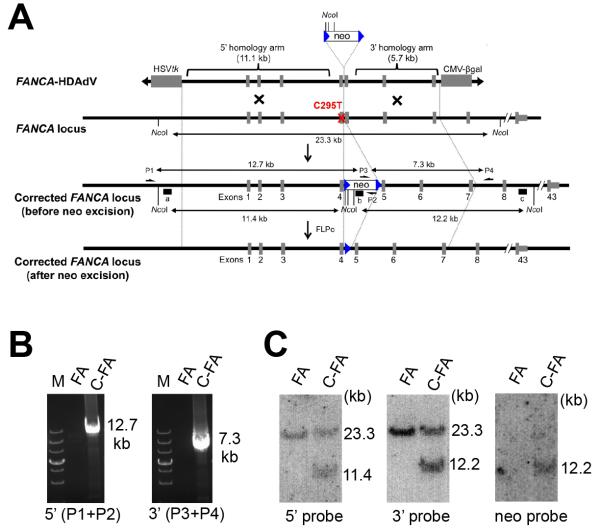
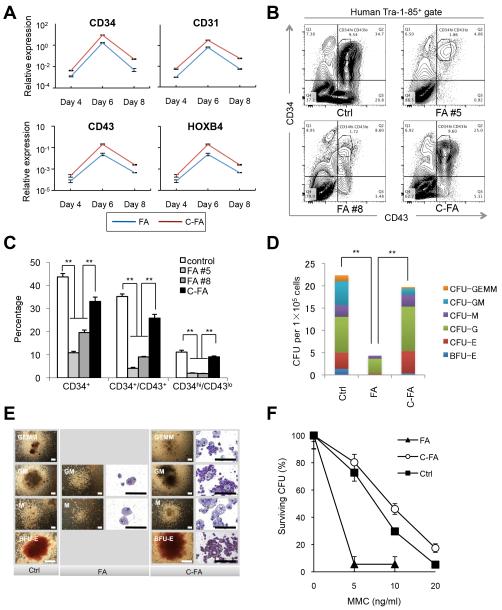
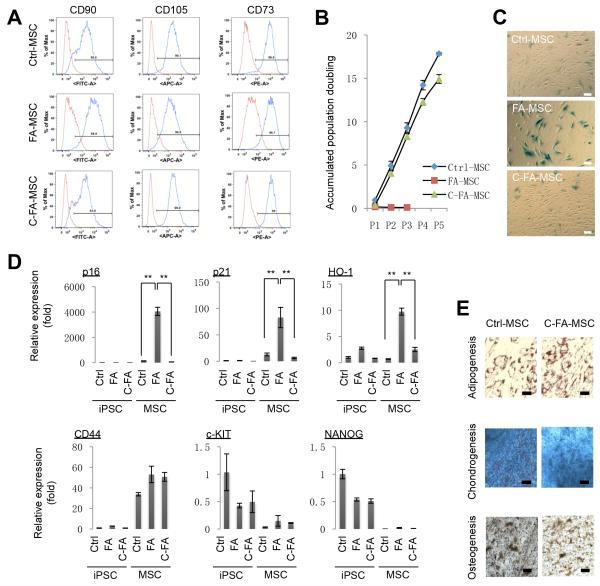
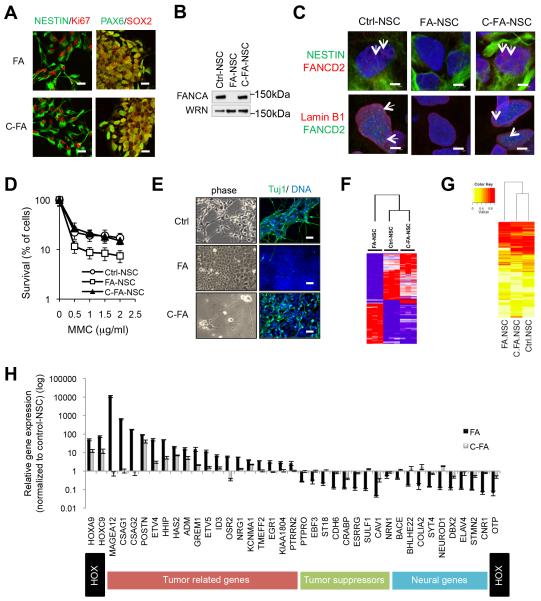
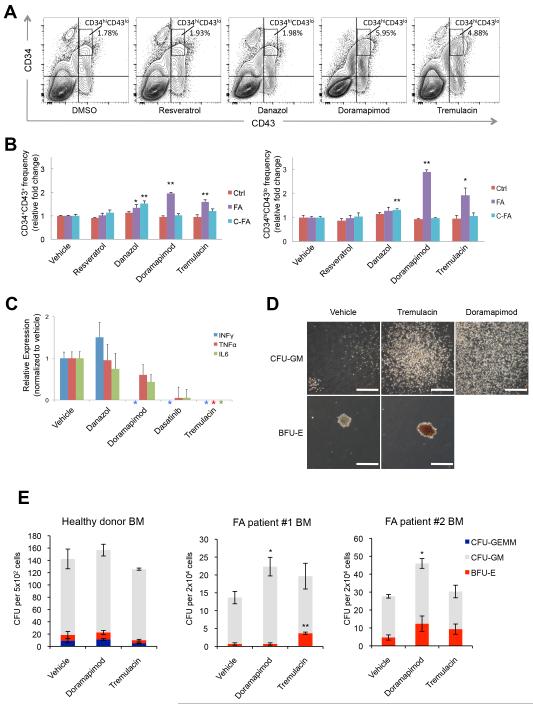
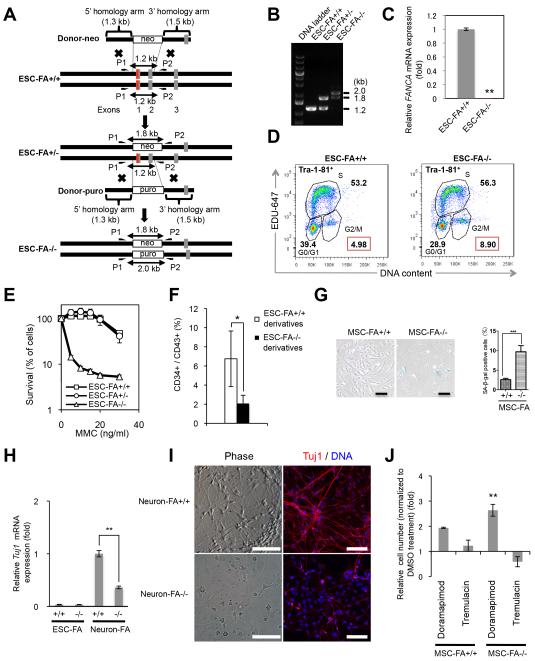
Fanconi anaemia (FA) is a recessive disorder characterized by genomic instability, congenital abnormalities, cancer predisposition and bone marrow (BM) failure. However, the pathogenesis of FA is not fully understood partly due to the limitations of current disease models. Here, we derive integration free-induced pluripotent stem cells (iPSCs) from an FA patient without genetic complementation and report in situ gene correction in FA-iPSCs as well as the generation of isogenic FANCA-deficient human embryonic stem cell (ESC) lines. FA cellular phenotypes are recapitulated in iPSCs/ESCs and their adult stem/progenitor cell derivatives. By using isogenic pathogenic mutation-free controls as well as cellular and genomic tools, our model serves to facilitate the discovery of novel disease features. We validate our model as a drug-screening platform by identifying several compounds that improve hematopoietic differentiation of FA-iPSCs. These compounds are also able to rescue the hematopoietic phenotype of FA patient BM cells.


Figures

Fig. 1
Fig. 1. Generation of FA-specific iPSCs
A, DNA sequencing analysis revealed the presence of biallelic C295T point mutations in FANCA in FA-iPSCs, and the targeted correction of a FANCA-mutant allele in FA-iPSCs (C-FA-iPSCs). B, NANOG immunostaining of control (Ctrl) and patient (FA) colonies at day 25 and day 40 of reprogramming, respectively. Scale bar, 2 cm. C, Quantification of the number of NANOG-positive colonies at the end of reprogramming experiments. Numbers are normalized against control (mean±s.d., n=3, *p<0.05, t-test). shp53 indicates the use of p53 shRNA in the reprogramming cocktail. In both hypoxia (5%) and normoxia conditions, there were no NANOG-positive colonies without p53 shRNA. D, Immunofluorescence analysis of pluripotency markers OCT4 and NANOG in FA-iPSCs and C-FA-iPSCs. DNA was stained with Hoechst. Bar, 20 μm. E, Copy number quantification of reprogramming factor genes (left panel) and the episomal vector element EBNA1 (right panel). H9 human ESCs were included as a negative control. Human fibroblasts (hFib) 6 days after nucleofection were included as a positive control. The average copy numbers are comparable between H9 human ESCs and five randomly selected FA-iPSCs. Data are shown as mean±s.d. n=3.
Fig. 2
Fig. 2. Characterization of FA-specific iPSCs
A, DNA methylation profile of the OCT4 promoter region in control-, FA-iPSCs and C-FA-iPSCs. A diagram showing the position of the CpG dinucleotides relative to the OCT4 transcription start site is provided. B, RT-qPCR analysis of endogenous expression of the indicated pluripotency genes in the indicated lines. FA fibroblast and H9 human ESCs (Ctrl-ESC) were included as negative and positive controls, respectively. Data are shown as mean±s.d. n=3. C, Immunostaining in teratomas derived from FA-iPSCs show in vivo differentiation towards ectodermal, mesodermal and endodermal tissues. Scale bar, 75 μm. D, Western blotting analysis of FANCA expression in iPSCs, MSCs, and fibroblasts (Fib) treated with or without MMC. Ku80 was included as a loading control. Also see Supplementary Fig. 8. E, Karyotyping analysis revealed normal karyotypes in all of the indicated iPSC lines. For FA-iPSC, four clones were randomly selected. C-FA-iPSC#1 and C-FA-iPSC#2 indicate FA-iPSCs corrected by HR and lentiviral vector, respectively.
Fig. 3
Fig. 3. FA-iPSCs recapitulate FA cellular defects
A, FACS analysis of cell cycle profiles of the indicated iPSCs revealed an increased percentage of G2/M phase cells (indicated in red squares) in two randomly selected FA-iPSCs. C-FA-iPSC#1 indicates the targeted gene-correction clone. Values shown are mean±s.d. B, An identical number of iPSCs were seeded onto MEF feeder cells in the presence of ROCK inhibitor and allowed to form small colonies. The relative iPSC colony numbers were determined 10 days later. Data are shown as mean±s.d. n=3. **p<0.01 (t-test). C, MMC sensitivity of Ctrl-iPSCs, FA-iPSCs, C-FA-iPSCs#1, and FA-iPSCs lentivirally transduced with FANCA (C-FA-iPSC#2). Data are shown as mean±s.d. n=8. D, DEB induced chromosomal fragility test. Statistical analyses were performed by comparing Ctrl-iPSCs with other samples. Data are shown as mean±s.d. n=35 **p<0.01 (t-test). E, Western blotting analysis of FANCA and FANCD2 expression in indicated iPSC lines. WRN was included as a loading control. L-FANCD2 and S-FANCD2 indicate the mono-ubiquitinated and non-modified form of FANCD2, respectively. Quantitative analysis shows that targeted correction of the FANCA gene (C-FA-iPSC#1) or lentiviral introduction of FANCA in FA-iPSCs (C-FA-iPSC#2) restored expression of FANCA protein and mono-ubiquitination of FANCD2. F, Immunostaining of FANCD2 and SOX2 in the indicated iPSCs treated with 100 ng/ml MMC for 24 h. The percentage of nuclei positive for FANCD2 foci is indicated in the bottom left corner. Bar, 10 μm. Arrows denote FANCD2 foci.
Fig. 4
Fig. 4. Gene correction of FA-specific iPSCs
A, Schematic representation of HDAdV-based correction of the C295T mutation at the FANCA locus. The HDAd-vector includes a neomycin-resistant cassette (neo) and an HSVtk cassette to allow for positive and negative selection, respectively. Half arrows indicate primer sites for PCR (P1, P2, P3 and P4). Probes for Southern analysis are shown as black bars (a, 5′ probe; b, neo probe; c, 3′ probe). The red X indicates the mutation site in exon 4. Blue triangles indicate the FLPo recognition target (FRT) site. B, PCR analysis of FA-iPSCs (FA) and gene corrected FA-iPSCs (C-FA) using 5′ primer pair (P1 and P2; 12.7 kb) or 3′ primer pair (P3 and P4; 7.3 kb). M, DNA ladder. C, Southern blot analysis. The approximate molecular weights (kb) corresponding to the bands are indicated.
Fig. 5
Fig. 5. Hematopoietic differentiation of FA-iPSCs and characterization of FA-iPSC-derived HPCs
FA-iPSCs were differentiated by using a murine OP9 stromal cell-based differentiation protocol that allows robust generation of hematopoietic cells for downstream quantitative analyses. A, RT-qPCR analysis of the kinetics of the upregulation of hematopoietic lineage specific marker genes during hematopoietic differentiation of FA-iPSCs (FA) and FA-iPSCs corrected by HR (C-FA). Expression levels are normalized against GAPDH. Data are shown as mean±s. e.m. n=3. B, FACS analysis of the CD34+ and CD43+ populations 13 days after hematopoietic differentiation of control iPSCs, FA-iPSCs (#5 and #8 clones) and C-FA-iPSCs. Cells shown are in the Tra-1-85+ gate, which shows only human cells. Numbers represent percentages. C, Percentage of differentiated iPSCs that are CD34+(Q1 & Q2 in B), CD34+/CD43+ (Q2 in B) and CD34hi/CD43lo (small gate in Q2 in B). Error bars represent SEM of 3 independent experiments. ** p<0.01 (t-test). D-E, Colony forming assays of human iPSC-derived hematopoietic progenitors harvested after 14 days of differentiation. Data are representative results from two independent experiments. Quantification of the indicated colony types derived from a total of 1×10⁵ starting differentiated cells. CFU-GEMM, colony-forming unit granulocyte/erythroid/macrophage/megakaryocyte; CFU-GM, colony-forming unit granulocyte/monocyte; CFU-M, colony-forming unit macrophage; CFU-G, colony-forming unit granulocyte; CFU-E, colony-forming unit erythroid; BFU-E, blast-forming unit erythroid. n=3. ** p<0.01 (t-test). (D). Representative photos of colony morphology (left columns) and Wright staining of cytospins (right columns) of different hematopoietic colonies are shown (E). Scale bar, 300 μm. F, MMC sensitivity of Ctrl-iPSC-, FA-iPSC- and C-FA-iPSC-derived blood lineage colonies. Data are shown as mean±s.d. n=4.
Fig. 6
Fig. 6. MSCs derived from FA-iPSCs demonstrate characteristics of premature senescence
A, FACS analyses of common MSC surface markers on MSCs differentiated from control-iPSCs, FA-iPSCs, and FA-iPSCs corrected by HR (C-FA-iPSCs). B, Growth curve representing the accumulated population doubling of iPSC-derived MSCs. Data are shown as mean±s.d. n=3. C, Representative SA-β-galactosidase staining in passage 3 MSCs derived from control-, FA-, C-FA-iPSCs. Bar, 10 μm. Note that senescent FA-MSCs are larger in size. D, RT-qPCR analysis of the indicated gene transcripts in iPSCs and their MSC derivatives. Data are shown as mean±s.d. n=3. **p<0.01 (t-test). At mRNA levels, MSCs demonstrated significant upregulation of MSC-specific marker CD44 and downregulation of pluripotency marker NANOG. No significant difference was observed in NANOG and c-KIT expression between the isogenic pairs (FA-iPSCs and C-FA-iPSCs). When compared with control MSCs, FA-MSCs showed a robust upregulation of the cell proliferation suppressor p21, the cell senescence marker p16 and the stress sensor HO-1, at passage 1. E, Control- and C-FA-iPSC-derived MSCs were induced to undergo adipogenesis, chondrogenesis, and osteogenesis. Oil red, Alcian blue, and von Kossa were employed for staining of adipocyte, cartilage, and bone-specific markers, respectively. Scale bar, 25 μm.
Fig 7
Fig 7. Cellular defects and molecular signatures of NSCs derived from FA-iPSCs
A, Immunofluorescence analysis of neural progenitor markers in FA-iPSC derived NSCs (FA-NSCs) and C-FA-iPSC derived NSCs (C-FA-NSCs). Bar, 20 μm. B, Western blotting analysis of FANCA expression in control-iPSC derived NSCs (Ctrl-NSC), FA-NSCs and C-FA-NSCs. WRN expression was included as a loading control. Also see Supplementary Fig. 8. C, Immunostaining of FANCD2, lamin B1 and NESTIN in the indicated NSCs treated with 100 ng/ml MMC for 24 h. Arrows denote FANCD2 foci. Bar, 5 μm. D, MMC sensitivity of indicated NSCs. Data are shown as mean±s.d. n=8. E, Representative bright field (left panels) and Tuj1 immunofluorescence (right panels) micrographs of cultures spontaneously differentiated from Ctrl-, FA-, and C-FA-NSCs. DNA was counterstained with Hoechst. Bar, 50 μm. F, Hierarchical clustering analysis of genes with a minimum 3-fold difference in both comparisons (Ctrl-NSC vs. FA-NSC; FA-NSC vs. C-FA-NSC). 96% of genes (97 out of 101) altered by the FA mutation were rescued in gene corrected NSCs. Also see Supplementary Data 1. G, Heatmap and hierarchical clustering of DNA methylation levels at CpG sites in the promoter regions of the genes rescued by C-FA-NSC. Note that not every gene rescued by C-FA-NSC from gene expression analysis showed differential DNA methylation on their promoter regions. H, RT-qPCR analysis of the expression of selected genes in passage 2 NSCs derived from Ctrl-, FA-, and C-FA-iPSCs. The expression levels of genes in Ctrl-NSCs were set to one. Data are shown as mean±s.d. n=3. Gene functions are annotated below gene names.
Fig 8
Fig 8. Small-molecule screen for compounds rescuing FA hematopoietic defects
Two randomly selected clones, FA-iPSC#5 and FA-iPSC#8 (data not shown) were used in this experiment and provided consistent results. A, FACS analysis of the CD34+ and CD43+ populations at day 13 of hematopoietic differentiation of FA-iPSC#5 after one-week treatment with vehicle (DMSO), resveratrol (1 μM), danazol (50 ng/ml), doramapimod (5 μM) and tremulacin (5 nM). B, Quantification of percentages of FA-HPCs that are CD34+/CD43+ and CD34hi/CD43lo after drug treatments indicated in A. Error bars represent SEM of 3 independent experiments. * p<0.05 and ** p<0.01 (t-test). C, RT-qPCR quantification of expression levels of interferon gamma (INFγ), tumor necrosis factor alpha (TNFα) and Interleukin 6 (IL6) in differentiation cultures of FA-iPSCs treated with vehicle (DMSO), danazol (50 ng/ml), doramapimod (5 μM), dasatinib (5 μM) and tremulacin (5 nM). Expression levels are normalized against GAPDH. Asterisks denote expression levels below the detection limit. D-E, Colony forming assay of FA patient BM mononuclear cells treated with compounds. Representative photos of the morphology of different hematopoietic colonies are shown (D). Bar, 500 μm. E, quantification of the indicated colony types derived from a total of 5×10² BM CD34+ cells and 2×10⁴ BM cells from healthy donors and FA patients, respectively. CFU-GEMM, colony-forming unit granulocyte/erythroid/macrophage/megakaryocyte; CFU-GM, colony-forming unit granulocyte/monocyte; BFU-E, blast-forming unit erythroid. Data are shown as mean±s.d. n=3. * p<0.05 and ** p<0.01 (t-test).
Fig. 9
Fig. 9. Generation and characterization of FANCA knockout ESCs
A, Schematic representation of TALEN-based knockout of the FANCA gene. The donor vectors include a neomycin-resistant cassette (neo) or a puromycin-resistant cassette (puro). Half arrows indicate primer sites for PCR (P1 and P2). The red line indicates the TALEN target site in exon 1. The human H9 cells were used as wild type host cells (ESC-FA+/+). The heterozygous FANCA mutant ESC line (ESC-FA+/−) was generated by one round of gene targeting, and the biallelic FANCA knockout mutant ESC line (ESC-FA−/−) was generated by a 2nd round of gene targeting. B, PCR analysis of ESC-FA+/+, ESC-FA+/− and ESC-FA−/− using P1 and P2 primer pairs shown in (A). M, DNA ladder. C, RT-PCR analysis of ESC-FA+/+ and ESC-FA−/−. ESC-FA−/− did not express FANCA mRNA. Data are shown as mean±s.d. n=3. ** p<0.01 (t-test). D, FACS analysis of cell cycle profiles of the indicated ESCs revealed an increased percentage of G2/M phase cells (indicated in red squares) in FANCA knockout cell (ESC-FA−/−). E, MMC sensitivity of ESC-FA+/+, ESC-FA+/− and ESC-FA−/−. Data are shown as mean±s.d. n=8. F, Percentage of differentiated ESCs that are CD34+/CD43+. Error bars represent SEM of 3 independent experiments. * p<0.05 (t-test). G, Representative SA-β-galactosidase staining (left panel, Scale bar, 200 μm) in passage 1 MSCs derived from ESC-FA+/+ and ESC-FA−/−, and quantitative data (right panel). H, RT-qPCR analysis of TUJ1 in ESCs and their pan neuron derivatives. Data are shown as mean±s.d. n=3. ** p<0.01 (t-test). I, Representative bright field (left panels) and Tuj1 immunofluorescence (right panels) micrographs of cultures spontaneously differentiated from NSC-FA+/+ and NSC-FA−/−. DNA was counterstained with Hoechst. Bar, 100 μm. J, Quantification of accumulated doubling population of FA-MSCs with doramapimod or tremulacin treatments at passage 5. The drug effects were normalized by the number of DMSO treated cells. Data are shown as mean±s.d. n=3. * p<0.05 (t-test).

References

    1. Kim H, D’Andrea AD. Regulation of DNA cross-link repair by the Fanconi anemia/BRCA pathway. Genes Dev. 2012;26:1393–1408. - PMC - PubMed
    1. Zhang QS, et al. Tempol protects against oxidative damage and delays epithelial tumor onset in Fanconi anemia mice. Cancer Res. 2008;68:1601–1608. - PubMed
    1. Bogliolo M, et al. Mutations in ERCC4, encoding the DNA-repair endonuclease XPF, cause Fanconi anemia. Am J Hum Genet. 2013;92:800–806. - PMC - PubMed
    1. Moldovan GL, D’Andrea AD. How the fanconi anemia pathway guards the genome. Annu Rev Genet. 2009;43:223–249. - PMC - PubMed
    1. Ceccaldi R, et al. Bone marrow failure in fanconi anemia is triggered by an exacerbated p53/p21 DNA damage response that impairs hematopoietic stem and progenitor cells. Cell Stem Cell. 2012;11:36–49. - PMC - PubMed

Publication types

Substances

Associated data