. 2014 Jul 7;9(7):e101772.
doi: 10.1371/journal.pone.0101772. eCollection 2014.

Cross-talk-free multi-color STORM imaging using a single fluorophore

Affiliations

Cross-talk-free multi-color STORM imaging using a single fluorophore

Johnny Tam et al. PLoS One. .

Erratum in

  • PLoS One. 2014;9(10):e111878

Abstract

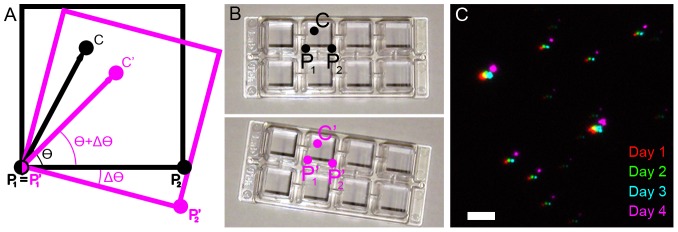
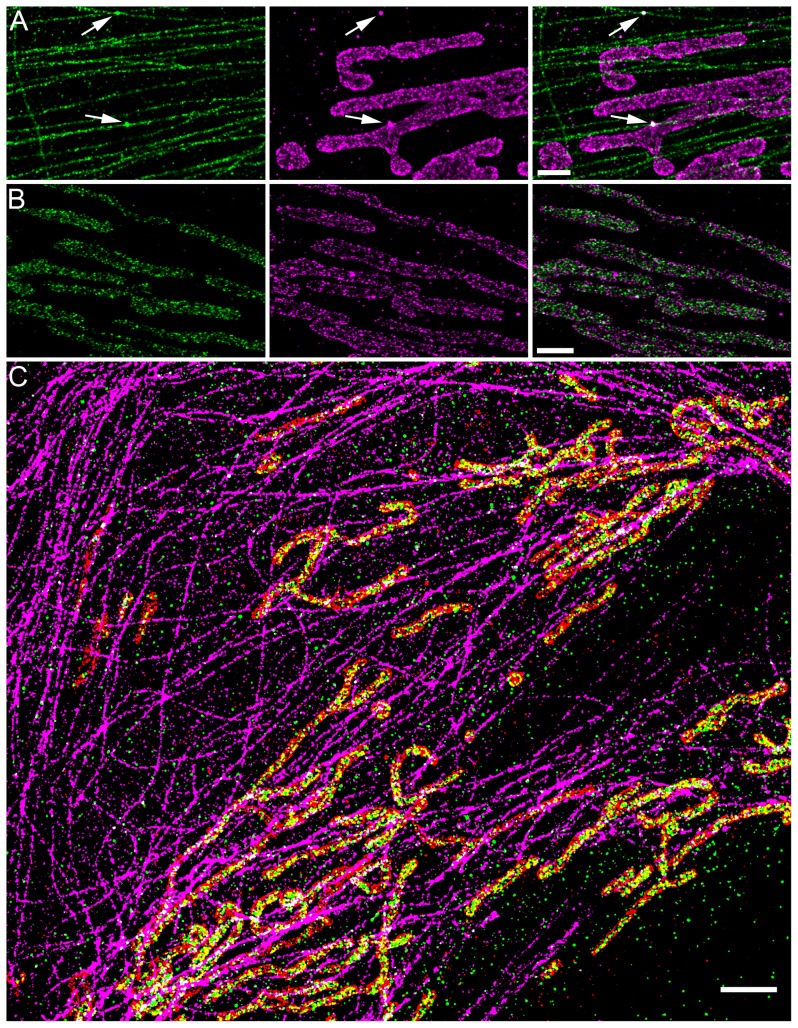
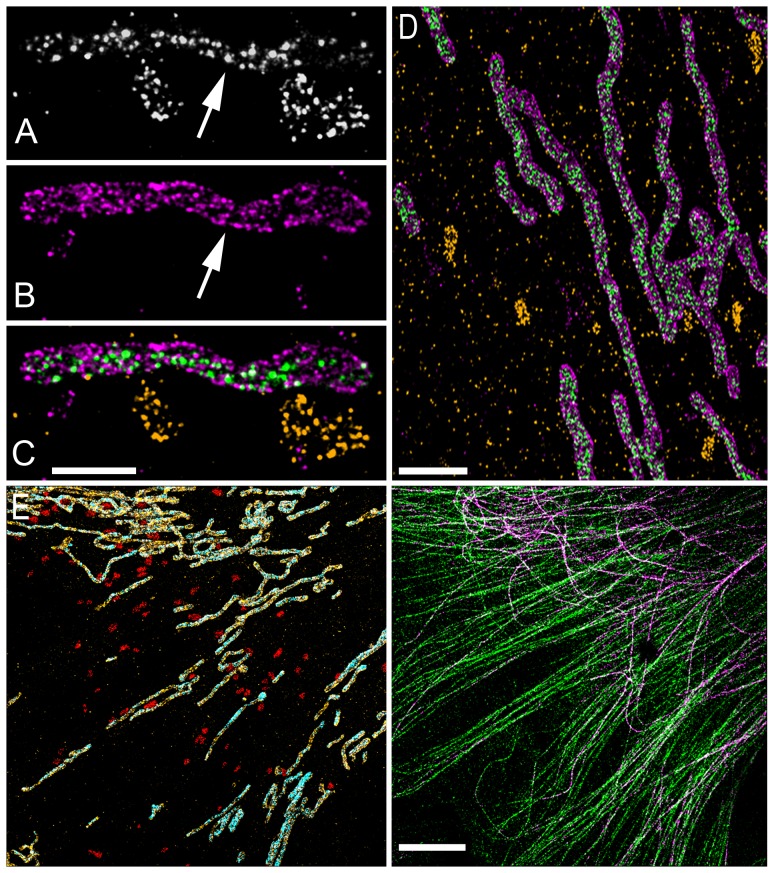
Multi-color stochastic optical reconstruction microscopy (STORM) is routinely performed; however, the various approaches for achieving multiple colors have important caveats. Color cross-talk, limited availability of spectrally distinct fluorophores with optimal brightness and duty cycle, incompatibility of imaging buffers for different fluorophores, and chromatic aberrations impact the spatial resolution and ultimately the number of colors that can be achieved. We overcome these complexities and develop a simple approach for multi-color STORM imaging using a single fluorophore and sequential labelling. In addition, we present a simple and versatile method to locate the same region of interest on different days and even on different microscopes. In combination, these approaches enable cross-talk-free multi-color imaging of sub-cellular structures.


Conflict of interest statement

Competing Interests: The authors have declared that no competing interests exist.

Figures

Figure 1
Figure 1. Virtual grid to relocate the same region of interest.
(A–B) During the first imaging session, the coordinates of two reference points are recorded (P1 and P2, typically the corner coordinates of the sample chamber as shown in B) as well as the coordinates of the region of interest, C. During the subsequent imaging sessions, the new coordinates of the reference points are recorded (P1' and P2') and these coordinates along with the previously recorded coordinates of the reference points and region of interest are used to calculate the new coordinates of the region of interest (C′). (C) Fiduciary markers (fluorescent beads) imaged on four subsequent days using the “virtual grid” approach to locate them. Scale bar 5 µm.
Figure 2
Figure 2. Multi-color STORM imaging using a single fluorophore.
(A) Microtubules (green) and mitochondrial outer membrane protein Tom20 (magenta) imaged sequentially using the same fluorophore activator-reporter pair (AlexaFluor405-AlexaFluor647). Arrows show the localized positions of fiduciary markers (fluorescent beads) that were used for image alignment. (B) Mitochondrial outer membrane protein Tom20 (magenta) and inner membrane protein ATP Synthase (green). (C) Three-color image of microtubules (green), mitochondrial outer membrane protein Tom20 (magenta) and mitochondrial inner membrane protein (ATP-synthase, orange) imaged sequentially using the same fluorophore activator-reporter pair (AlexaFluor405-AlexaFluor647). The discontinuous appearance of microtubules is due to the fact that we have used an anti-GFP antibody to label the GFP-α-tubulin and the endogenous α-tubulin is unlabelled in this scheme. The anti-GFP antibody was used since it offers a different antibody species to those used for ATP-synthase and Tom20. Scale bars, 1 µm (A–B), and 2 µm (C).
Figure 3
Figure 3. Multi-color STORM imaging using overlapping antibody species.
(A) An image of ATP-synthase (localized to mitochondria) and LAMP2 (localized to lysosomes) both labelled using a mouse monoclonal primary and anti-mouse secondary antibody and imaged at the same time. (B) An image of Tom20, a mitochondrial outer membrane protein. Since Tom20 and ATP-synthase colocalize on mitochondria (arrows), the colocalization can be used to separate the initial image into separate colors. (C) ATP-synthase is identified as those molecules which colocalize with Tom20. Lysosomes are identified as those molecules which do not colocalize with Tom20. (D) A zoom-out of the three color Tom20 (magenta), ATP-Synthase (green), lysosome (orange) STORM image. (E) A five-color STORM image of mitochondrial outer membrane protein Tom20 (orange), mitochondrial inner membrane protein ATP-synthase (cyan), lysosomal protein Lamp2 (red), total tubulin (green) and acetylated tubulin (magenta). The five-color image is split between the two panels to more clearly display the different structures. The acetylated tubulin, ATP-synthase, and Lamp2 are all imaged using mouse primary antibodies. The acetylated tubulin colocalizes with total tubulin and ATP-synthase colocalizes with Tom20; Lamp2 does not colocalize with either total tubulin nor Tom20. Scale bars, 500 nm (C), 2 µm (D) and 5 µm (E).
Figure 4
Figure 4. Conceptual application of multi-color STORM imaging using the same antibody species and same fluorophore.
(A) Protein A (green) on the pre-synaptic structure (orange) and Protein B (green) on the post-synaptic structure (red) simultaneously colocalize with a third protein, Protein C (purple). (B) Protein C (purple) separately colocalizes with both Protein A (green) on the pre-synaptic structure (orange) and Protein B (green) on the post-synaptic structure (red) but rarely colocalizes with both proteins simultaneously. Sequential imaging using the same antibody species to label Protein A and B can be used to distinguish between these two scenarios (C) A second example following the same scenario as (A) and (B) but with mitochondrial inner and outer membrane proteins.

References

    1. Rust MJ, Bates M, Zhuang X (2006) Sub-diffraction-limit imaging by stochastic optical reconstruction microscopy (STORM). Nat Methods 3: 793–795. - PMC - PubMed
    1. Betzig E, Patterson GH, Sougrat R, Lindwasser OW, Olenych S, et al. (2006) Imaging intracellular fluorescent proteins at nanometer resolution. Science 313: 1642–1645. - PubMed
    1. Hess ST, Girirajan TP, Mason MD (2006) Ultra-high resolution imaging by fluorescence photoactivation localization microscopy. Biophys J 91: 4258–4272. - PMC - PubMed
    1. Thompson RE, Larson DR, Webb WW (2002) Precise nanometer localization analysis for individual fluorescent probes. Biophys J 82: 2775–2783. - PMC - PubMed
    1. Yildiz A, Selvin PR (2005) Fluorescence imaging with one nanometer accuracy: application to molecular motors. Acc Chem Res 38: 574–582. - PubMed

Publication types

LinkOut - more resources