Comparative Study
. 2014 Jul 7;9(7):e101920.
doi: 10.1371/journal.pone.0101920. eCollection 2014.

Potential role for HIV-specific CD38-/HLA-DR+ CD8+ T cells in viral suppression and cytotoxicity in HIV controllers

Affiliations
Comparative Study

Potential role for HIV-specific CD38-/HLA-DR+ CD8+ T cells in viral suppression and cytotoxicity in HIV controllers

Stéphane Hua et al. PLoS One. .

Abstract

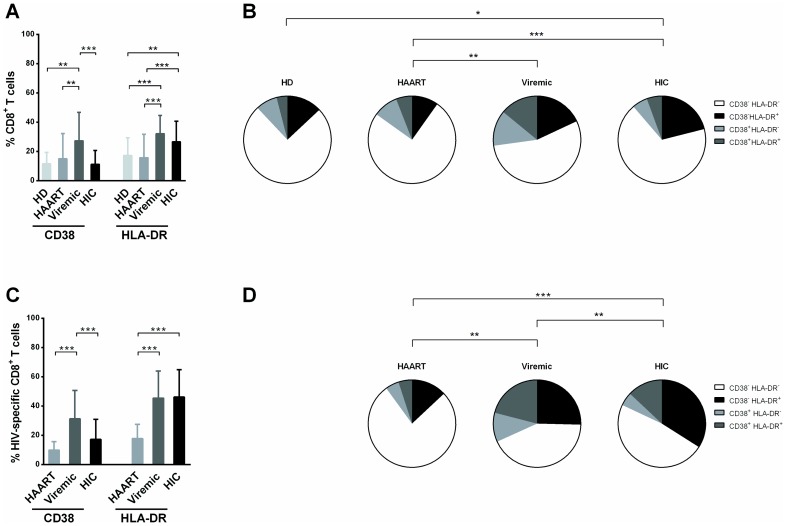
Background: HIV controllers (HIC) are rare HIV-1-infected patients who exhibit spontaneous viral control. HIC have high frequency of CD38-/HLA-DR+ HIV-specific CD8+ T cells. Here we examined the role of this subset in HIC status.

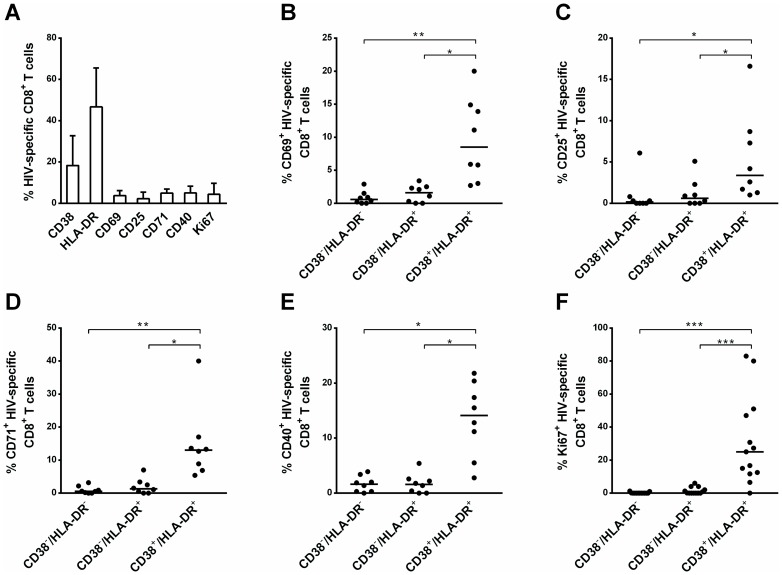
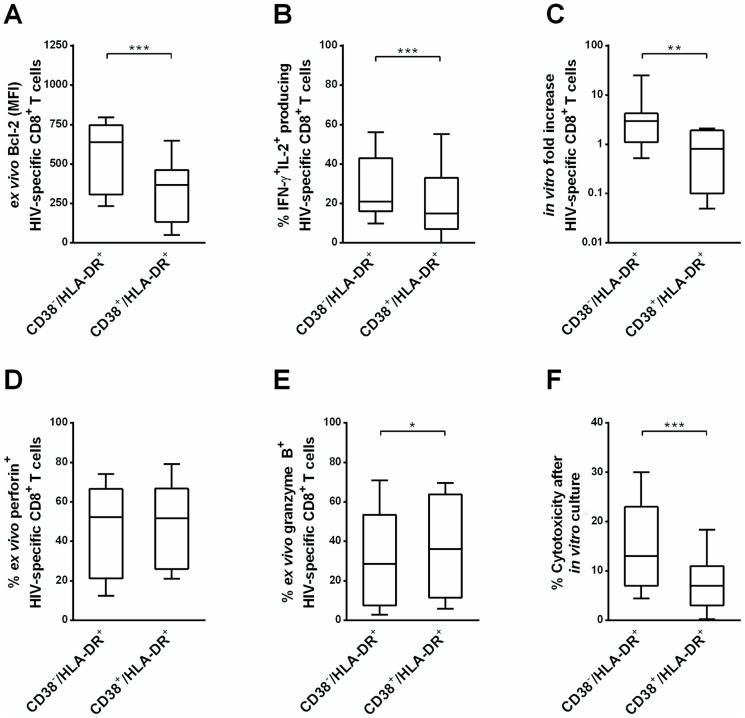
Materials and methods: We compared CD38-/HLA-DR+ CD8+ T cells with the classical CD38+/HLA-DR+ activated phenotype in terms of 1) their activation status, reflected by CD69, CD25, CD71, CD40 and Ki67 expression, 2) functional parameters: Bcl-2 expression, proliferative capacity, and IFN-γ and IL-2 production, and 3) cytotoxic activity. We also investigated how this particular profile is generated.

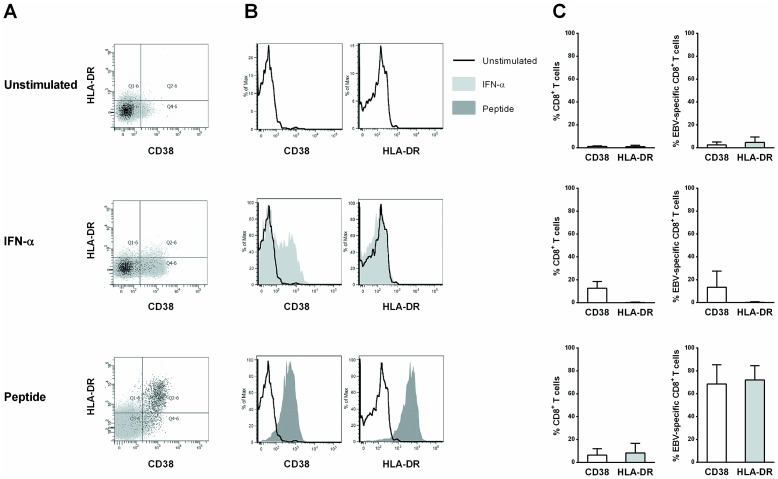
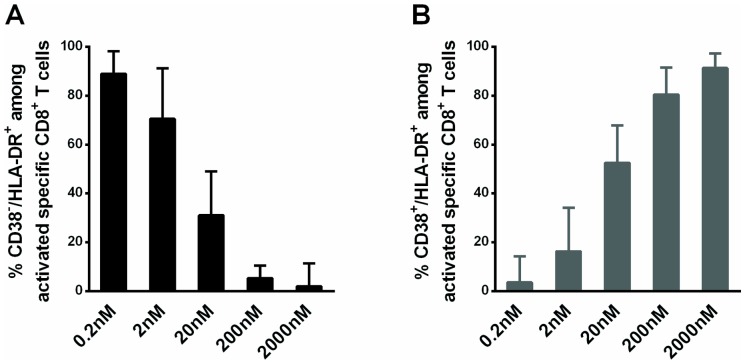
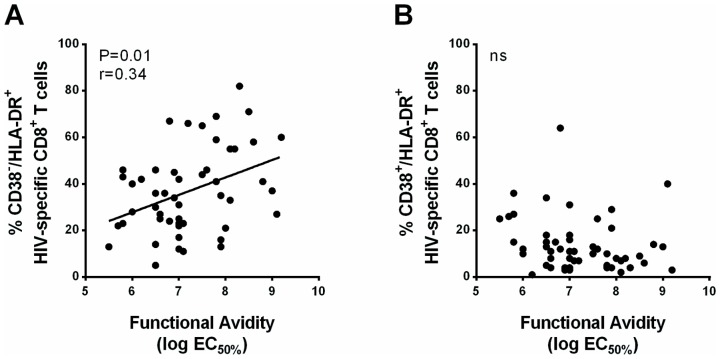
Results: Compared to CD38+/HLA-DR+ cells, CD38-/HLA-DR+ cells exhibited lower expression of several activation markers, better survival capacity (Bcl-2 MFI, 367 [134-462] vs 638 [307-747], P = 0.001), higher frequency of polyfunctional cells (15% [7%-33%] vs 21% [16%-43%], P = 0.0003), greater proliferative capacity (0-fold [0-2] vs 3-fold [2]-[11], P = 0.007), and higher cytotoxicity in vitro (7% [3%-11%] vs 13% [6%-22%], P = 0.02). The CD38-/HLA-DR+ profile was preferentially generated in response to low viral antigen concentrations.

Conclusions: These data highlight the role of CD38-/HLA-DR+ HIV-specific CD8+ T cell cytotoxicity in HIC status and provide insights into the mechanism by which they are generated. Induction of this protective CD8+ subset may be important for vaccine strategies.


Conflict of interest statement

Competing Interests: The authors have declared that no competing interests exist.

Figures

Figure 1
Figure 1. CD38 and HLA-DR expression on bulk and HIV-specific CD8+ T cells.
(A) Proportions of bulk CD8+ T cells from HD (n = 16, light gray bars), HAART-treated patients (n = 19, mid gray bars), viremic patients (n = 21, dark gray bars) and HIC (n = 79, black bars) expressing CD38 and HLA-DR. (C) Proportions of HIV-specific CD8+ T cells from HAART-treated patients (n = 13, mid gray bars), viremic patients (n = 39, dark gray bars) and HIC (n = 80, black bars) expressing CD38 and HLA-DR. Pie charts representing CD38/HLA-DR (white), CD38/HLA-DR+ (black), CD38+/HLA-DR (light gray) and CD38+/HLA-DR+ (dark gray) cells among bulk (B) and HIV-specific CD8+ T cells (D). Statistical differences shown in the pie charts are based on the difference in the frequency of the CD38/HLA-DR+ subset between the different groups. * P<0.05, ** P<0.01, *** P<0.001.
Figure 2
Figure 2. Activation phenotype of CD38/HLA-DR, CD38/HLA-DR+ and CD38+/HLA-DR+ subsets from HIC.
(A) Proportions of HIV-specific CD8+ T cells expressing CD38, HLA-DR, CD69, CD25, CD71, CD40 and Ki67. (B–F) Proportions of CD38/HLA-DR, CD38/HLA-DR+ and CD38+/HLA-DR+ HIV-specific CD8+ T cells expressing CD69 (B), CD25 (C), CD71 (D), CD40 (E) and Ki67 (F) (n = 8). * P<0.05, ** P<0.01, *** P<0.001.
Figure 3
Figure 3. Qualitative features of CD38/HLA-DR+ and CD38+/HLA-DR+ HIV-specific CD8+ T cell subsets in HIC.
(A) Bcl-2 expression on CD38/HLA-DR+ and CD38+/HLA-DR+ HIV-specific CD8+ T cells (n = 11). (B) Proportion of CD38/HLA-DR+ and CD38+/HLA-DR+ HIV-specific CD8+ T cells producing both IFN-γ and IL-2 among HIV-specific CD8+ T cells producing IFN-γ or IL-2 (n = 35). (C) Fold increase in CD38/HLA-DR+ and CD38+/HLA-DR+ HIV-specific CD8+ T cell numbers after 5 days of culture with HIV peptides (2 µM) (n = 7). (D–E) Proportion of CD38/HLA-DR+ and CD38+/HLA-DR+ HIV-specific CD8+ T cells producing perforin (D) and granzyme B (E) (n = 35). (F) Graphs representing percentage cytotoxicity (measured as granzyme-B-mediated intracellular cleavage of a fluorogenic substrate) of CD38/HLA-DR+ and CD38+/HLA-DR+ HIV-specific CD8+ T cells (n = 11). * P<0.05, ** P<0.01, *** P<0.001.
Figure 4
Figure 4. Influence of stimulatory conditions on the activation phenotype of specific CD8+ T cells.
(A) Representative dot plots of HLA-DR and CD38 expression in unstimulated conditions (upper graph), after IFN-α stimulation (middle graph) or peptide stimulation (2 µM, lower graph) among specific (dark dots) and non-specific (gray dots) CD8+ T cells from healthy donors after a four-day culture period. CD38 and HLA-DR expression on bulk (C left panel) and specific CD8+ T cells (B and C right panel). (B) Flow cytometry histograms showing representative results for cells from one individual in unstimulated conditions (dark lines), after IFN-α stimulation (light gray histograms) or peptide stimulation (dark gray histograms). (C) Surface expression of CD38 (white bars) and HLA-DR (gray bars) on bulk and specific CD8+ T cells (n = 4).
Figure 5
Figure 5. Stimulation with a low antigen concentration induces the CD38/HLA-DR+ phenotype on specific CD8+ T cells.
(A) Graphs representing the frequency of (A) CD38/HLA-DR+ cells (dark histograms) and (B) CD38+/HLA-DR+ cells (dark gray histograms) among activated EBV-specific healthy donor CD8+ T cells (i.e. those expressing CD38 and/or HLA-DR) after a four-day culture period (n = 8).
Figure 6
Figure 6. High antigen sensitivity is associated with a high frequency of CD38/HLA-DR+ cells in HIC.
The antigen sensitivity of HIV-specific CD8+ T cells was measured in ELISpot assays with serial limiting dilutions of antigenic peptides (from 10−5 to 10−11 M) and was expressed as the log molar concentration of peptide yielding 50% of the maximum response (EC50%). Correlations between the proportion of CD38/HLA-DR+ (A) or CD38+/HLA-DR+ (B) and the antigen sensitivity of HIV-specific CD8+ T cells from HIC. Correlations were evaluated using the Spearman rank correlation coefficient. The Spearman r correlation and the Pearson correlation curve are indicated for significant correlations (n = 47).

References

    1. Deeks SG, Walker BD (2007) Human immunodeficiency virus controllers: mechanisms of durable virus control in the absence of antiretroviral therapy. Immunity 27: 406–416 10.1016/j.immuni.2007.08.010 - DOI - PubMed
    1. Lambotte O, Boufassa F, Madec Y, Nguyen A, Goujard C, et al. (2005) HIV Controllers: A Homogeneous Group of HIV-1—Infected Patients with Spontaneous Control of Viral Replication. Clin Infect Dis 41: 1053–1056 10.1086/433188 - DOI - PubMed
    1. Sáez-Cirión A, Pancino G (2013) HIV controllers: a genetically determined or inducible phenotype? Immunol Rev 254: 281–294 10.1111/imr.12076 - DOI - PubMed
    1. Carrington M, O'Brien SJ (2003) The influence of HLA genotype on AIDS. Annu Rev Med 54: 535–551 10.1146/annurev.med.54.101601.152346 - DOI - PubMed
    1. Carrington M, Walker BD (2012) Immunogenetics of spontaneous control of HIV. Annu Rev Med 63: 131–145 10.1146/annurev-med-062909-130018 - DOI - PMC - PubMed

Publication types