. 2014 Aug 15;193(4):1709-16.
doi: 10.4049/jimmunol.1400034. Epub 2014 Jul 7.

Increased antitumor effects using IL-2 with anti-TGF-β reveals competition between mouse NK and CD8 T cells

Affiliations

Increased antitumor effects using IL-2 with anti-TGF-β reveals competition between mouse NK and CD8 T cells

Maite Alvarez et al. J Immunol. .

Abstract

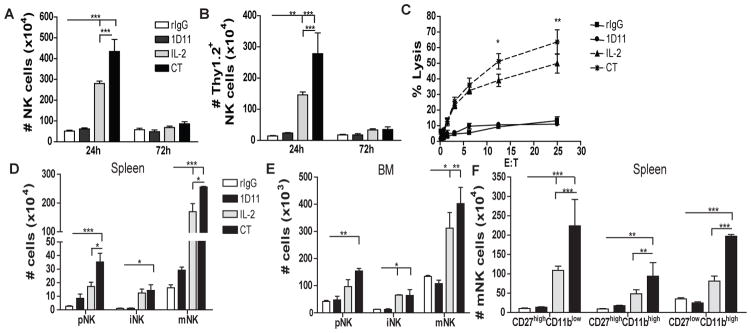
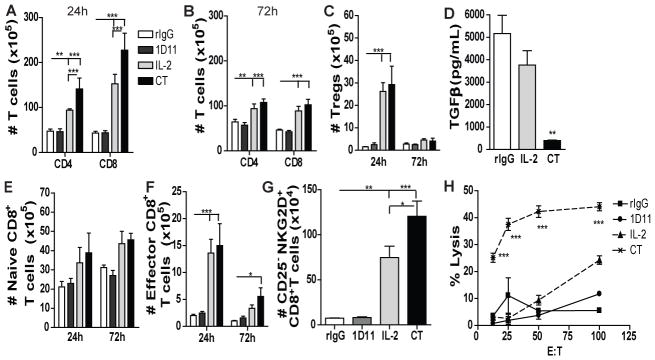
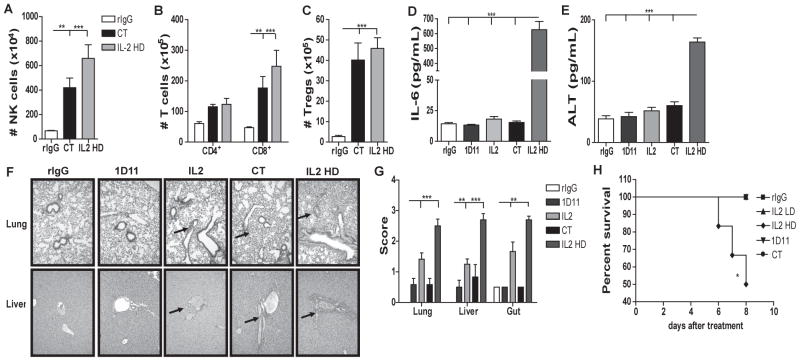
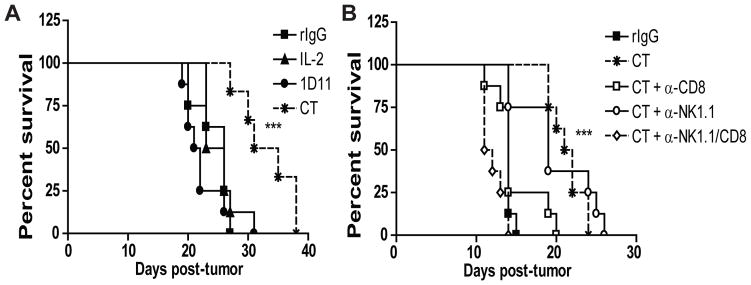
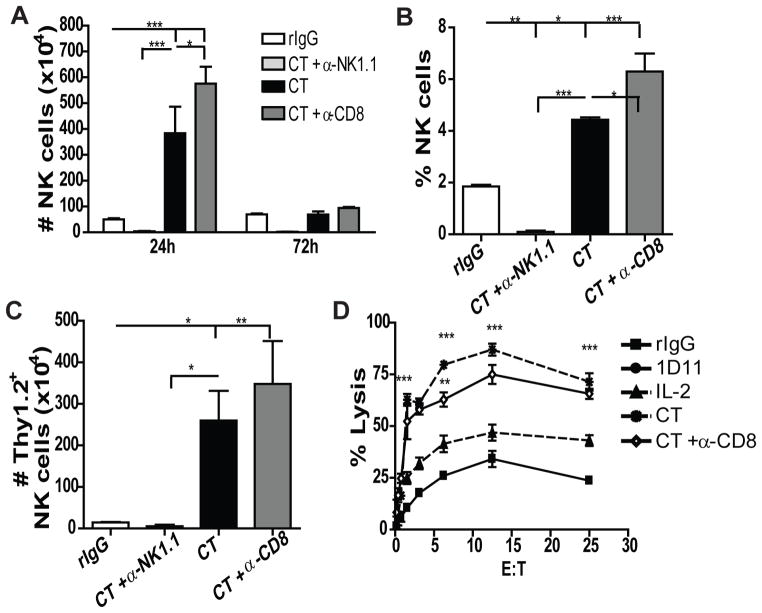
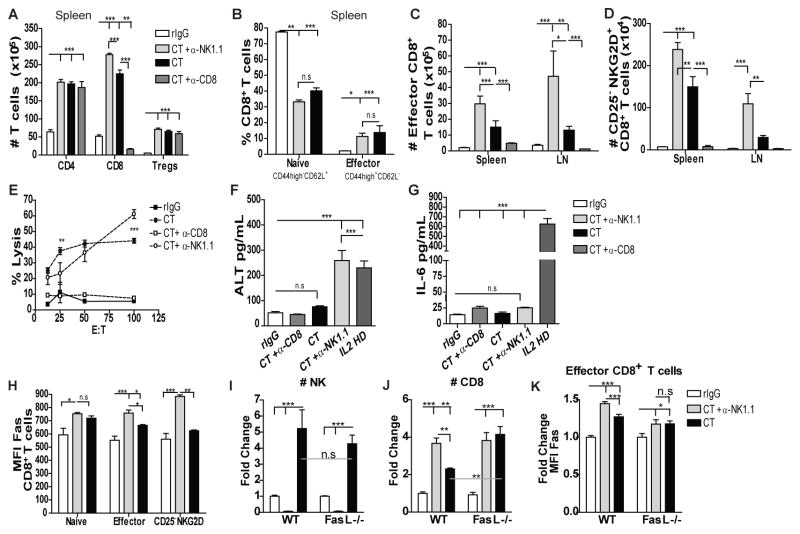
Because of increasing interest in the removal of immunosuppressive pathways in cancer, the combination of IL-2 with Abs to neutralize TGF-β, a potent immunosuppressive cytokine, was assessed. Combination immunotherapy resulted in significantly greater antitumor effects. These were correlated with significant increases in the numbers and functionality of NK cells, NK cell progenitors, and activated CD8 T cells, resulting in the observed antitumor effects. Combination immunotherapy also was accompanied by lesser toxicities than was IL-2 therapy alone. Additionally, we observed a dual competition between NK cells and activated CD8 T cells such that, after immunotherapy, the depletion of either effector population resulted in the increased total expansion of the other population and compensatory antitumor effects. This study demonstrates the efficacy of this combination immunotherapeutic regimen as a promising cancer therapy and illustrates the existence of potent competitive regulatory pathways between NK cells and CD8 T cells in response to systemic activation.


Conflict of interest statement

The authors disclose no conflict of interest.

Figures

Fig 1
Fig 1. Combination of IL2 and anti-TGFβ significantly increases NK cell population, improves NK function in mice and promotes NK cell maturation
24h or 72h after the end of treatment spleen or BM of C57BL/6 mice were collected and single cell suspensions were stained for NK cell phenotypic analysis by flow cytometry. (A) Total number of NK cells (CD45+CD3NK1.1+) is shown for mice treated with rIgG/PBS (white bars), 1D11 (dark gray bars), LD IL2 (IL2: light gray bars) or combination of both (CT: black bars). (B) Total number of Thy1.2+ NK cells. (C) Percentage of tumor lysis of purified NK cells cultured at different effector:target (E:T) ratios was assessed. (D–E) Total number of cells that are precursor NK (pNK:CD3CD122+NKG2D+NK1.1DX5), immature NK (iNK:CD3CD122+NKG2D+NK1.1+DX5) and mature NK (mNK:CD3CD122+NKG2D+NK1.1+DX5+) cells for spleen and BM at 24h. (C) Distribution of CD27 and CD11b at 24h from spleen is shown. Data are representative of two or three experiments with 3 mice per group (mean ± SEM). One-Way Anova or Two-Way Anova was used to assess significance. Significant differences are displayed for comparisons with rIgG control group as well as between IL2 and CT groups (*p<0.05, **p<0.01, ***p<0.001).
Fig 2
Fig 2. IL2 and TGFβ blockade results in T cell expansion with improved CD8 T cell function
Single cell suspension from spleen were stained for CD45, CD3, CD8, CD4, CD44, CD62L or CD45, CD3, CD4, CD25 and Foxp3 to determine the distribution of CD4 T cell, CD8 T cell and Tregs. (A–C) Total number of CD4 T cells (CD45+CD3+CD4+), CD8 T cells (CD45+CD3+CD8+) and Tregs (CD45+CD3+CD4+CD25+Foxp3+) at 24h and 72h. (D) TGFβ Levels in the serum of treated mice at 24h. (E–F) Total number of naïve CD8 T cells (CD45+CD3+CD8+CD44CD62L) and effector CD8 T cells (CD45+CD3+CD8+CD44+CD62L) at 24h and 72h. (G) Total number of bystander memory-activated CD8 T cells (CD45+CD3+CD8+CD44+CD25NKG2D+) at 24h. ((H) CD8 T cell-specific lysis of P815 tumor cells from splenocytes of treated mice assessed by redirected killing assay. Data are representative of 3 independent experiments with 3 mice per group (mean ± SEM). One-Way Anova or Two-Way Anova was used to assess significance. Significant differences are displayed for comparisons with rIgG control group as well as between IL2 and CT groups (*p<0.05, **p<0.01, ***p<0.001).
Fig 3
Fig 3. Combination therapy results in similar expansion of NK and T cells without induction of toxicity observed in HD IL2-treated mice
(A–C) Total number of NK, CD4, CD8 T cells and Tregs in the spleen at 24h post-treatment. rIgG (white bars), CT (LD IL2 + 1D11) (black bars) or IL2 HD (1 million IU) (gray bars). (D–E) Serum IL6 and alanine transaminase (ALT) levels at 24h. (F) Representative images of histopathology slides of liver and lungs. (G) Scoring of H&E histology slides of livers, gut, and lungs at 24h. (H) Percentage of survival during treatment. Black arrows indicate periportal lymphocytic aggregates that are more significant in HD IL2 treated mice. Data is representative of at least two independent experiments with 3 mice per group (mean ± SEM). One-Way Anova or logrank test (H) was used to assess significance. Significant differences are displayed for comparisons with rIgG control group. (*p<0.05, **p<0.01, ***p<0.001).
Fig 4
Fig 4. Prolonged tumor survival after treatment with IL2 and anti-TGFβ is NK and CD8 T cell-dependent
(A–B) Percent survival of mice treated with either rIgG, LD IL2, 1D11, or CT with or without NK and/or CD8 T cell depletion. Data are representative of two independent experiments with 8 mice per group. Statistical analysis was performed using logrank test. Significance for IL2 single therapy versus CT therapy treated mice (A) and between CT therapy and CT plus anti-NK1.1/CD8 treated mice (B) is shown (***p<0.001)
Fig 5
Fig 5. CD8 T cell depletion improves NK cell expansion during NK stimulation
C57BL/6 mice were treated with rIgG (white bars) or LD IL2 (0.2 million IU) and 1D11 (CT: black bars) as previously described. Some groups additionally received anti-NK1.1 (light gray bars), anti-CD8 (dark gray bars) or rIgG (black bars) two days prior to treatment. (A) Total number of NK cells is shown at 24h and 72h in the spleen. (B) Percentage of NK cells at 24h after end of treatment in the spleen. (C) Number of Thy1.2+ NK cells at 24h in the spleen. (D) NK-dependent tumor lysis of purified NK cells from the spleen against Yac-1 tumor cells. Data are representative of three independent experiments with 3 mice per group (mean ± SEM). One-Way Anova or Two-Way Anova was used to assess significance.(*p<0.05, **p<0.01, ***p<0.001).
Fig 6
Fig 6. NK cells negatively regulate CD8 T cell expansion after LD IL2 and anti-TGFβ stimulation in a Fas-FasL dependent manner to reduce CD8 T cell dependent toxicity
Single cell-suspension from spleens and LN were stained as previously described to determine T cell distribution at 24 and 72h. (A) Total number of CD4, CD8 T cells, and Tregs 24h after end of treatment from spleens (B) Percentage of effector and naive CD8 T cells 24h post-treatment. (C–D) Total number of effector and bystander CD8 T cells for the spleen and LN at 24h post-treatment. (E) CD8 T cell-specific tumor lysis. (F–G) ALT and IL6 serum levels at 24h. (H) MFI expression of Fas for naive, effector and bystander CD8 T cells is shown. WT or FasL-deficient mice were treated as previously and spleens were collected 24h after treatment. (I–J) Fold increase of NK and CD8 T cells 24h after treatment in WT and FasL-deficient mice. (K) Fold change in MFI expression of Fas for effector CD8 T cells in WT and FasL-deficient mice. Data are representative of 2–5 independent experiments (with 3 mice per group (mean ± SEM). One-Way Anova or Two-Way Anova was used to assess significance (n.s: no significance, *p<0.05, **p<0.01, ***p<0.001).

References

    1. Sutlu T, Alici E. Natural killer cell-based immunotherapy in cancer: current insights and future prospects. Journal of internal medicine. 2009;266:154–181. - PubMed
    1. Rosenberg SA, Yang JC, Topalian SL, Schwartzentruber DJ, Weber JS, Parkinson DR, Seipp CA, Einhorn JH, White DE. Treatment of 283 consecutive patients with metastatic melanoma or renal cell cancer using high-dose bolus interleukin 2. Jama. 1994;271:907–913. - PubMed
    1. Buyse M, Squifflet P, Lange BJ, Alonzo TA, Larson RA, Kolitz JE, George SL, Bloomfield CD, Castaigne S, Chevret S, Blaise D, Maraninchi D, Lucchesi KJ, Burzykowski T. Individual patient data meta-analysis of randomized trials evaluating IL-2 monotherapy as remission maintenance therapy in acute myeloid leukemia. Blood. 2011;117:7007–7013. - PMC - PubMed
    1. Peace DJ, Cheever MA. Toxicity and therapeutic efficacy of high-dose interleukin 2. In vivo infusion of antibody to NK-1.1 attenuates toxicity without compromising efficacy against murine leukemia. The Journal of experimental medicine. 1989;169:161–173. - PMC - PubMed
    1. Steel JC, Waldmann TA, Morris JC. Interleukin-15 biology and its therapeutic implications in cancer. Trends in pharmacological sciences. 2012;33:35–41. - PMC - PubMed

Publication types

MeSH terms