. 2014 Jul 7:15:224.
doi: 10.1186/1471-2474-15-224.

Contributions of biarticular myogenic components to the limitation of the range of motion after immobilization of rat knee joint

Affiliations

Contributions of biarticular myogenic components to the limitation of the range of motion after immobilization of rat knee joint

Momoko Nagai et al. BMC Musculoskelet Disord. .

Abstract

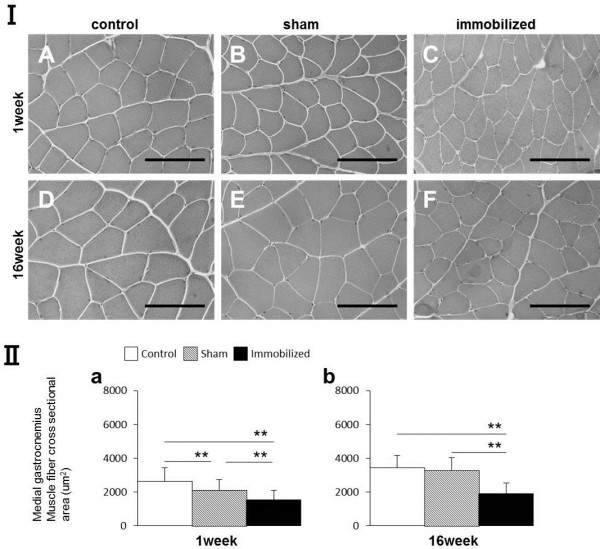
Background: Muscle atrophy caused by immobilization in the shortened position is characterized by a decrease in the size or cross-sectional area (CSA) of myofibers and decreased muscle length. Few studies have addressed the relationship between limitation of the range of motion (ROM) and the changes in CSA specifically in biarticular muscles after atrophy because of immobilization. We aimed to determine the contribution of 2 distinct muscle groups, the biarticular muscles of the post thigh (PT) and those of the post leg (PL), to the limitation of ROM as well as changes in the myofiber CSAs after joint immobilization surgery.

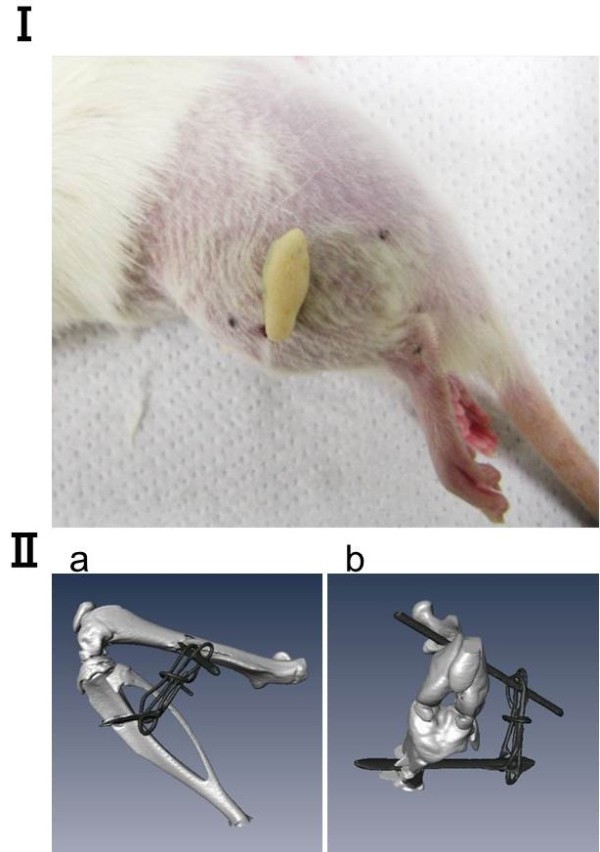
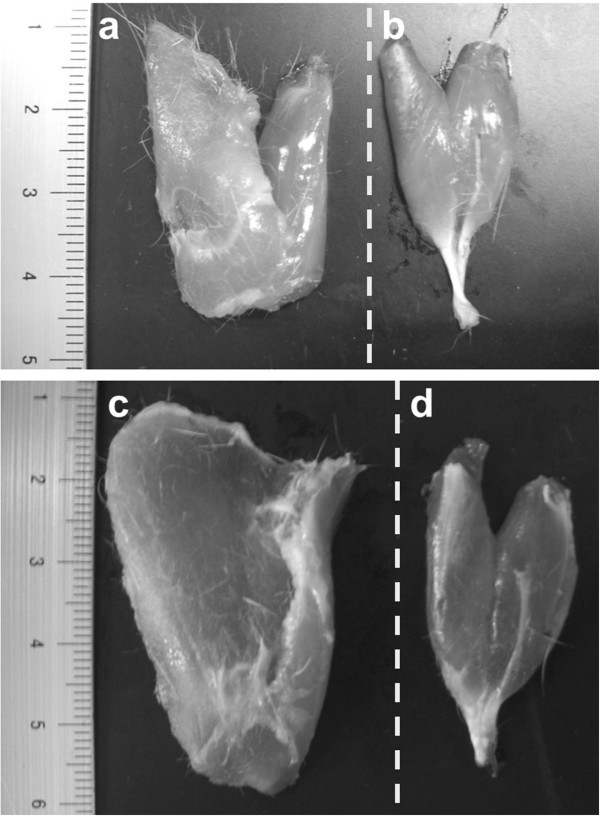
Methods: Male Wistar rats (n = 40) were randomly divided into experimental and control groups. In the experimental group, the left knee was surgically immobilized by external fixation for 1, 2, 4, 8, or 16 weeks (n = 5 each) and sham surgery was performed on the right knee. The rats in the control groups (n = 3 per time point) did not undergo surgery. After the indicated immobilization periods, myotomy of the PT or PL biarticular muscles was performed and the ROM was measured. The hamstrings and gastrocnemius muscles from the animals operated for 1 or 16 weeks were subjected to morphological analysis.

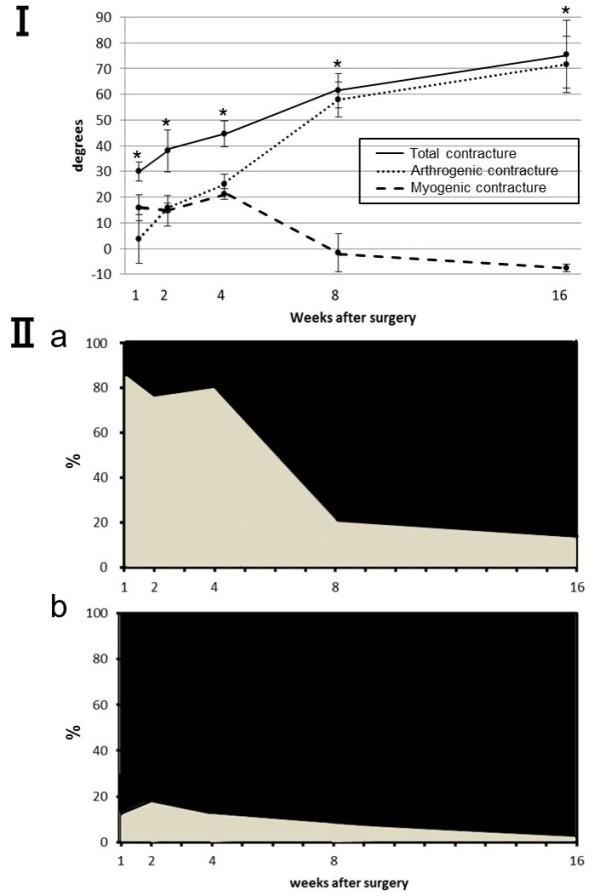
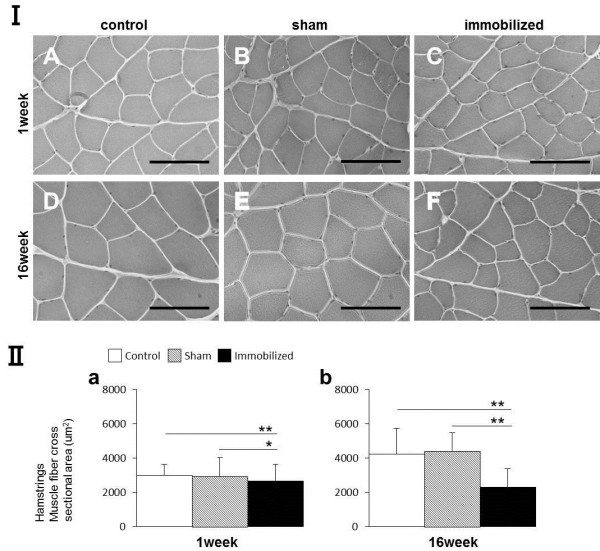
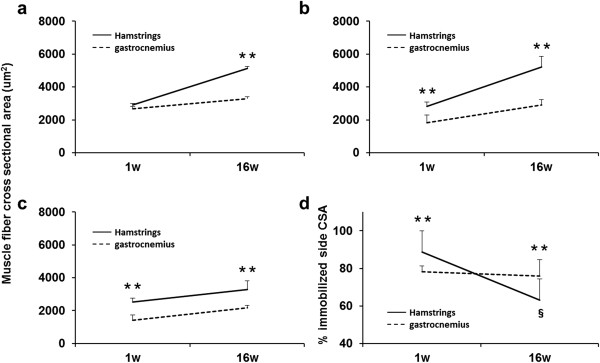
Results: In immobilized knees, the relative contribution of the PT biarticular myogenic components to the total restriction reached 80% throughout the first 4 weeks and decreased thereafter. The relative contribution of the PL biarticular myogenic components remained <20% throughout the immobilization period. The ratio of the myofiber CSA of the immobilized to that of the sham-operated knees was significantly lower at 16 weeks after surgery than at 1 week after surgery only in the hamstrings.

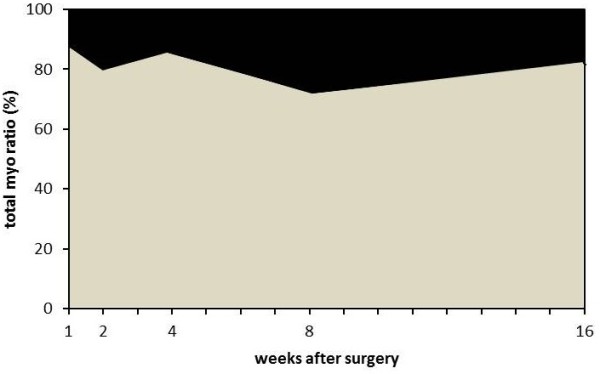
Conclusions: The relative contribution of the PT and PL components to myogenic contracture did not significantly change during the experimental period. However, the ratio of hamstrings CSAs to the sham side was larger than the ratio of medial gastrocnemius CSAs to the sham side after complete atrophy because of immobilization.


Figures

Figure 1
Figure 1
Rat knee joint immobilized by external flexion with wire and resin. (I) Photograph of the lateral view. (II) Micro-computed tomography analysis of the bone and wires from the (II-a) lateral and (II-b) front.
Figure 2
Figure 2
The myogenic and arthrogenic contractures in immobilized knee joints over time. (I) Results in degrees. As the duration of immobilization increased, the myogenic contracture decreased and the arthrogenic contracture increased. Values are presented as mean ± SD. *Significant difference in the restriction of extension ROM between the immobilized and sham knees. *P < 0.05. (II) Results as presented as the percent contributions of the biarticular muscles to the total restriction: (II-a) results for the PT, PT components shown in gray; results for other components shown in black; (II-b) results for the PL, PL components shown in gray; results for other components shown in black. The PT contribution peaked after the first week and decreased thereafter. The peak contribution of the PL was significantly less than that of the PT.
Figure 3
Figure 3
The percent contributions of the PT and PL to myogenic contracture. PL components shown in black; PT components shown in gray. The relative contributions of the PT and PL to myogenic contracture did not change throughout the experimental period.
Figure 4
Figure 4
Morphological analysis and myofiber CSAs measurements (μm2) of the hamstring muscle. (I) The CSA of the hamstring muscles of control, sham-operated, and immobilized knees after 1 and 16 weeks. (A, D) Control group. (B, E) Sham-operated knees. (C, F) Immobilized knees. Scale bars represent 100 μm (microscope magnification: ×400). (II-a, b) Measurement of the CSA (μm2) of the hamstring muscles (only one displayed). Values are presented as mean ± SD; *P < 0.05; **P < 0.001. The CSA in the immobilized knees was lower than that in the control or sham knees at both time points.
Figure 5
Figure 5
Morphological analysis and myofiber CSA measurements (μm2) of the medial gastrocnemius muscle. (I) The CSAs of the medial gastrocnemius muscle from the control, sham-operated, and immobilized knees after 1 and 16 weeks. (A, D) Control group. (B, E) Sham-operated knees. (C, F) Immobilized knees. Scale bars represent 100 μm (microscope magnification: ×400). (II-a, b) Measurement of the CSA (μm2) of the medial gastrocnemius muscle (only one displayed). Values are presented as mean ± SD; **P < 0.001. The CSA in the immobilized knees was lower than that of the control or sham knees at both time points.
Figure 6
Figure 6
Macroscopic observation of PT and PL of the control group after 1 and 16 weeks. (a) PT at the 1-week, (b) PL at 1 week, (c) PT at 16 weeks, (d) PL at 16 weeks. The dotted line shows the medial side. The muscle length of PT (including the hamstrings) were longer than that of PL (including the gastrocnemius).
Figure 7
Figure 7
Changes in the CSAs and comparison of hamstring and gastrocnemius cross sectional areas during the experimental periods. Cross-sectional area (μm2) of the control group (a), sham-operated group (b), and immobilized group (c). The ratio of the immobilized side CSA to the sham side CSA (%) (d). Values are presented as mean + SD; **, hamstring vs gastrocnemius at the same time point (P < 0.01); §, 1 week vs 16 weeks of hamstring (P < 0.01). Significant differences were found the CSAs between the hamstring and the medial gastrocnemius muscles at each time point in the all groups, except for at 1 week in the control group. The ratio was significantly lower after 16 weeks than after 1 week for the hamstring but not for the gastrocnemius. The myofiber CSAs of the hamstring were larger than those of the gastrocnemius at each time point in all groups, except for at 1 week in control group.

Similar articles

Cited by

References

    1. Hildebrand KA, Sutherland C, Zhang M. Rabbit knee model of post-traumatic joint contractures: the long-term natural history of motion loss and myofibroblasts. J Orthop Res. 2004;31:313–320. - PubMed
    1. van Bosse HJ, Feldman DS, Anavian J, Sala DA. Treatment of knee flexion contractures in patients with arthrogryposis. J Pediatr Orthop. 2007;27:930–937. - PubMed
    1. Frank C, Akeson WH, Woo SL, Amiel D, Coutts RD. Physiology and therapeutic value of passive joint motion. Clin Orthop Relat Res. 1984;185:113–125. - PubMed
    1. Oates BR, Glover EI, West DW, Fry JL, Tarnopolsky MA, Phillips SM. Low-volume resistance exercise attenuates the decline in strength and muscle mass associated with immobilization. Muscle Nerve. 2010;42:539–546. - PubMed
    1. Gajdok RL. Passive extensibility of skeletal muscle: review of the literature with clinical implications. Clin Biomech. 2001;16:87–101. - PubMed

Publication types

LinkOut - more resources