

Disruption of Mbd5 in mice causes neuronal functional deficits and neurobehavioral abnormalities consistent with 2q23.1 microdeletion syndrome
- PMID: 25001218
- PMCID: PMC4154129
- DOI: 10.15252/emmm.201404044
Disruption of Mbd5 in mice causes neuronal functional deficits and neurobehavioral abnormalities consistent with 2q23.1 microdeletion syndrome
Abstract
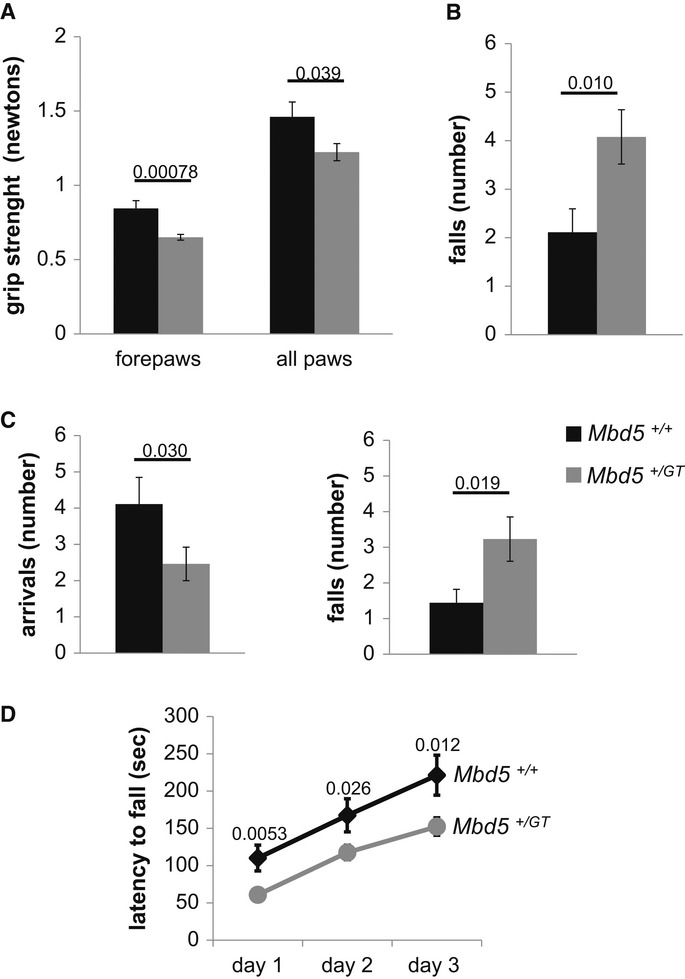
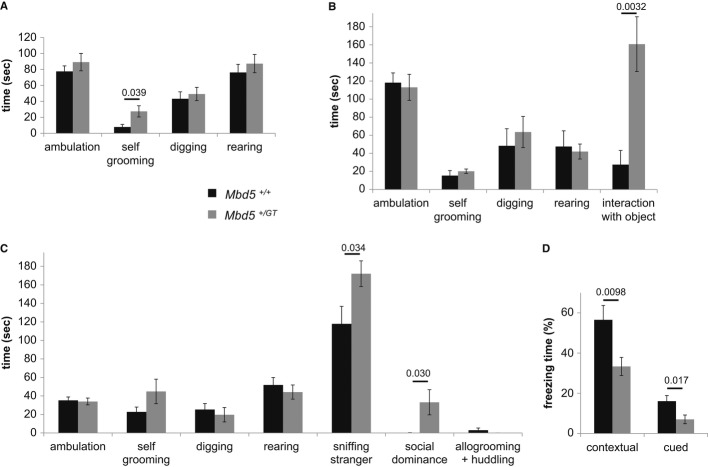
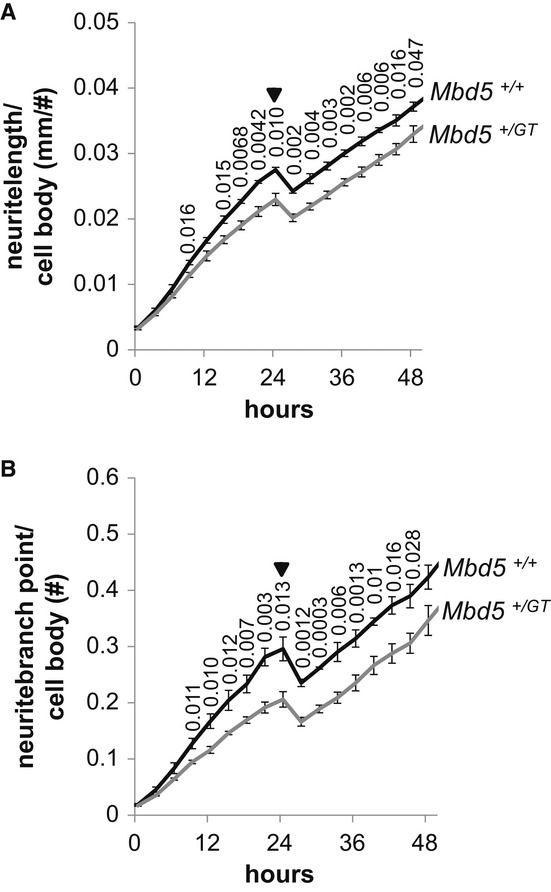
2q23.1 microdeletion syndrome is characterized by intellectual disability, motor delay, autistic-like behaviors, and a distinctive craniofacial phenotype. All patients carry a partial or total deletion of methyl-CpG-binding domain protein 5 (MBD5), suggesting that haploinsufficiency of this gene is responsible for the phenotype. To confirm this hypothesis and to examine the role of MBD5 in vivo, we have generated and characterized an Mbd5 gene-trap mouse model. Our study indicates that the Mbd5(+/) (GT) mouse model recapitulates most of the hallmark phenotypes observed in 2q23.1 deletion carriers including abnormal social behavior, cognitive impairment, and motor and craniofacial abnormalities. In addition, neuronal cultures uncovered a deficiency in neurite outgrowth. These findings support a causal role of MBD5 in 2q23.1 microdeletion syndrome and suggest a role for MBD5 in neuronal processes. The Mbd5(+/) (GT) mouse model will advance our understanding of the abnormal brain development underlying the emergence of 2q23.1 deletion-associated behavioral and cognitive symptoms.
Keywords: MBD5; autistic disorder; intellectual disability; mouse model.
© 2014 The Authors. Published under the terms of the CC BY 4.0 license.
Figures
Comment in
-
Trapping MBD5 to understand 2q23.1 microdeletion syndrome.EMBO Mol Med. 2014 Aug;6(8):993-4. doi: 10.15252/emmm.201404324. EMBO Mol Med. 2014. PMID: 25001217 Free PMC article.
Similar articles
-
The methyl binding domain containing protein MBD5 is a transcriptional regulator responsible for 2q23.1 deletion syndrome.Rare Dis. 2014 Nov 3;2(1):e967151. doi: 10.4161/2167549X.2014.967151. eCollection 2014. Rare Dis. 2014. PMID: 26942102 Free PMC article.
-
Trapping MBD5 to understand 2q23.1 microdeletion syndrome.EMBO Mol Med. 2014 Aug;6(8):993-4. doi: 10.15252/emmm.201404324. EMBO Mol Med. 2014. PMID: 25001217 Free PMC article.
-
Reciprocal deletion and duplication at 2q23.1 indicates a role for MBD5 in autism spectrum disorder.Eur J Hum Genet. 2014 Jan;22(1):57-63. doi: 10.1038/ejhg.2013.67. Epub 2013 May 1. Eur J Hum Genet. 2014. PMID: 23632792 Free PMC article.
-
MBD5 Haploinsufficiency.2016 Oct 27 [updated 2022 Apr 28]. In: Adam MP, Feldman J, Mirzaa GM, Pagon RA, Wallace SE, Amemiya A, editors. GeneReviews® [Internet]. Seattle (WA): University of Washington, Seattle; 1993–2025. 2016 Oct 27 [updated 2022 Apr 28]. In: Adam MP, Feldman J, Mirzaa GM, Pagon RA, Wallace SE, Amemiya A, editors. GeneReviews® [Internet]. Seattle (WA): University of Washington, Seattle; 1993–2025. PMID: 27786435 Free Books & Documents. Review.
-
Clinical and Molecular Aspects of MBD5-Associated Neurodevelopmental Disorder (MAND).Eur J Hum Genet. 2016 Aug;24(9):1235-43. doi: 10.1038/ejhg.2016.35. Epub 2016 May 25. Eur J Hum Genet. 2016. PMID: 27222293 Free PMC article. Review.
Cited by
-
Transcriptome analysis of MBD5-associated neurodevelopmental disorder (MAND) neural progenitor cells reveals dysregulation of autism-associated genes.Sci Rep. 2021 May 28;11(1):11295. doi: 10.1038/s41598-021-90798-z. Sci Rep. 2021. PMID: 34050248 Free PMC article.
-
Phenotypic and molecular convergence of 2q23.1 deletion syndrome with other neurodevelopmental syndromes associated with autism spectrum disorder.Int J Mol Sci. 2015 Apr 7;16(4):7627-43. doi: 10.3390/ijms16047627. Int J Mol Sci. 2015. PMID: 25853262 Free PMC article.
-
RINGs, DUBs and Abnormal Brain Growth-Histone H2A Ubiquitination in Brain Development and Disease.Epigenomes. 2022 Dec 2;6(4):42. doi: 10.3390/epigenomes6040042. Epigenomes. 2022. PMID: 36547251 Free PMC article. Review.
-
A-Z of Epigenetic Readers: Targeting Alternative Splicing and Histone Modification Variants in Cancer.Cancers (Basel). 2024 Mar 9;16(6):1104. doi: 10.3390/cancers16061104. Cancers (Basel). 2024. PMID: 38539439 Free PMC article. Review.
-
Deregulated mRNA and microRNA Expression Patterns in the Prefrontal Cortex of the BTBR Mouse Model of Autism.Mol Neurobiol. 2025 Aug;62(8):10614-10634. doi: 10.1007/s12035-025-04900-x. Epub 2025 Apr 14. Mol Neurobiol. 2025. PMID: 40227316 Free PMC article.
References
-
- American Psychiatric Association. Diagnostic and Statistical Manual of Mental Disorders (DSM-IV) Washington, DC: American Psychiatric Press, Inc; 2000. Text Revision.
-
- Amir RE, Van den Veyver IB, Wan M, Tran CQ, Francke U, Zoghbi HY. Rett syndrome is caused by mutations in X-linked MECP2, encoding methyl-CpG-binding protein 2. Nat Genet. 1999;23:185–188. - PubMed
-
- Araki M, Nakahara M, Muta M, Itou M, Yanai C, Yamazoe F, Miyake M, Morita A, Araki M, Okamoto Y, et al. Database for exchangeable gene trap clones: pathway and gene ontology analysis of exchangeable gene trap clone mouse lines. Dev Growth Differ. 2014;56:161–174. - PubMed
-
- Bestor TH, Bourc'his D. Transposon silencing and imprint establishment in mammalian germ cells. Cold Spring Harb Symp Quant Biol. 2004;69:381–387. - PubMed
Publication types
MeSH terms
Substances
LinkOut - more resources
Full Text Sources
Other Literature Sources
Medical
Molecular Biology Databases
Miscellaneous
