. 2014 Jul 17;41(1):75-88.
doi: 10.1016/j.immuni.2014.06.005. Epub 2014 Jul 4.

Memory CD8(+) T cells use cell-intrinsic lipolysis to support the metabolic programming necessary for development

Affiliations

Memory CD8(+) T cells use cell-intrinsic lipolysis to support the metabolic programming necessary for development

David O'Sullivan et al. Immunity. .

Erratum in

Abstract

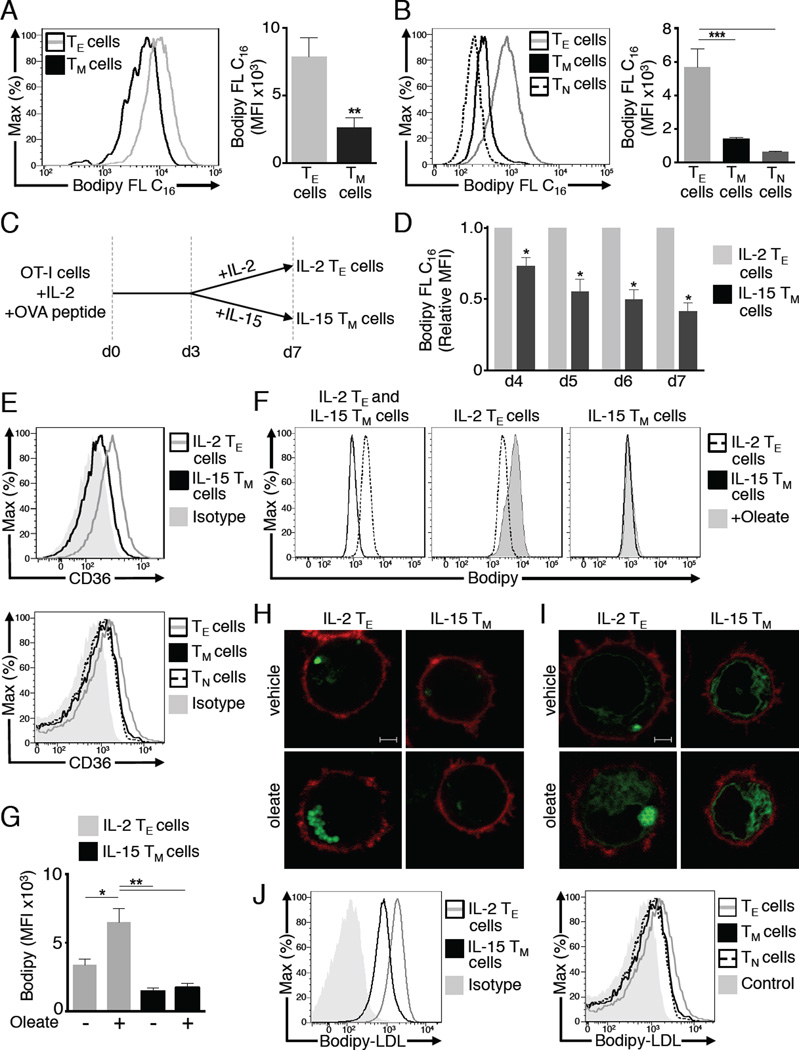
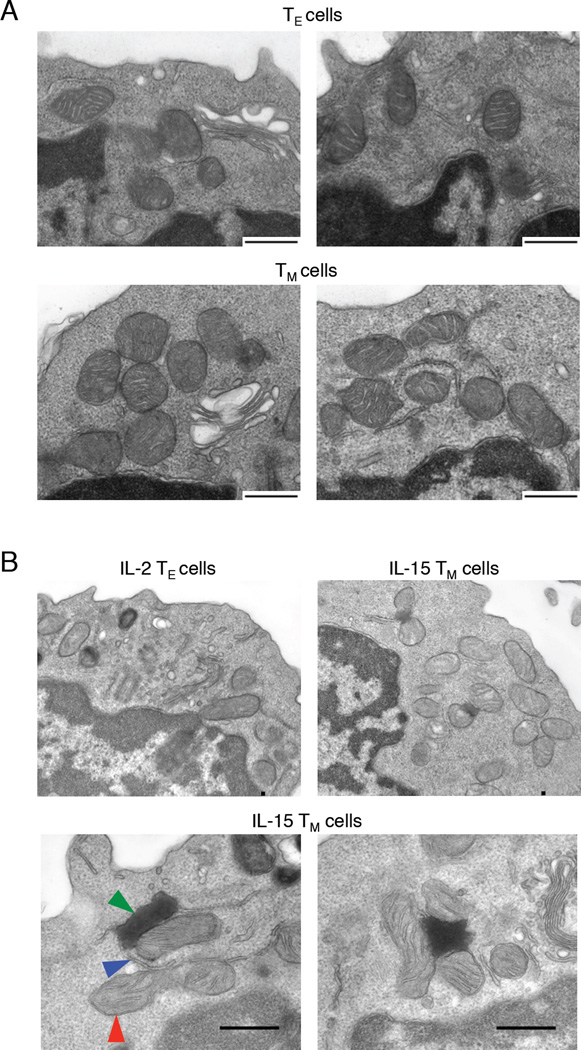
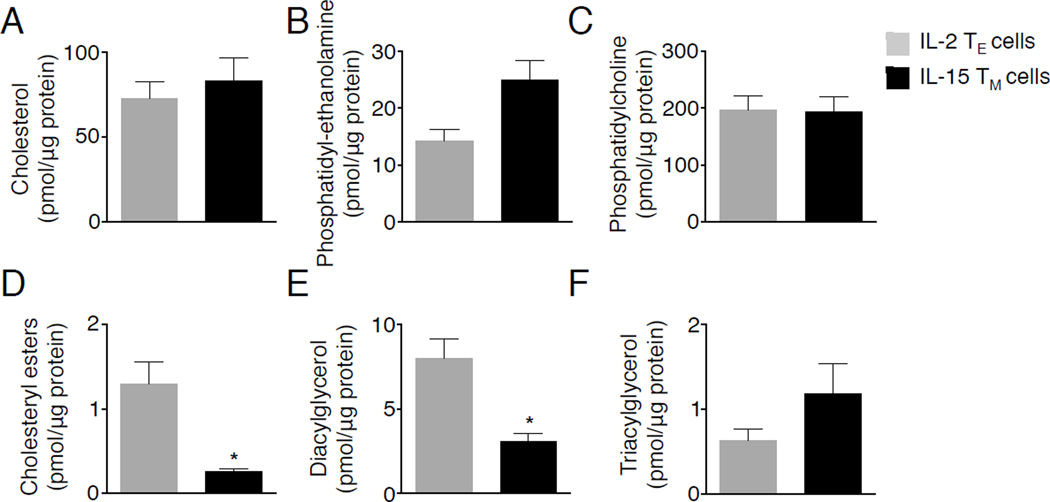
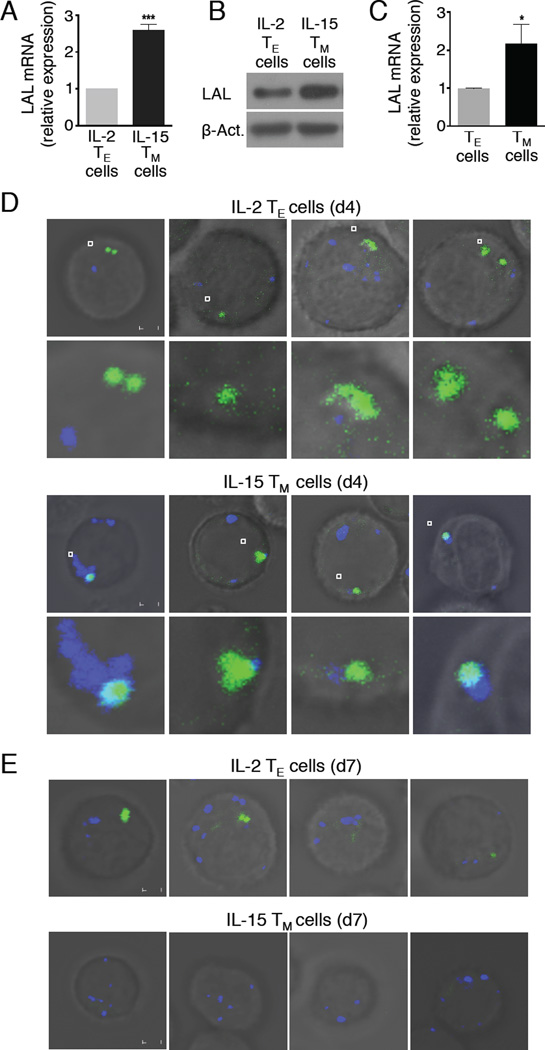
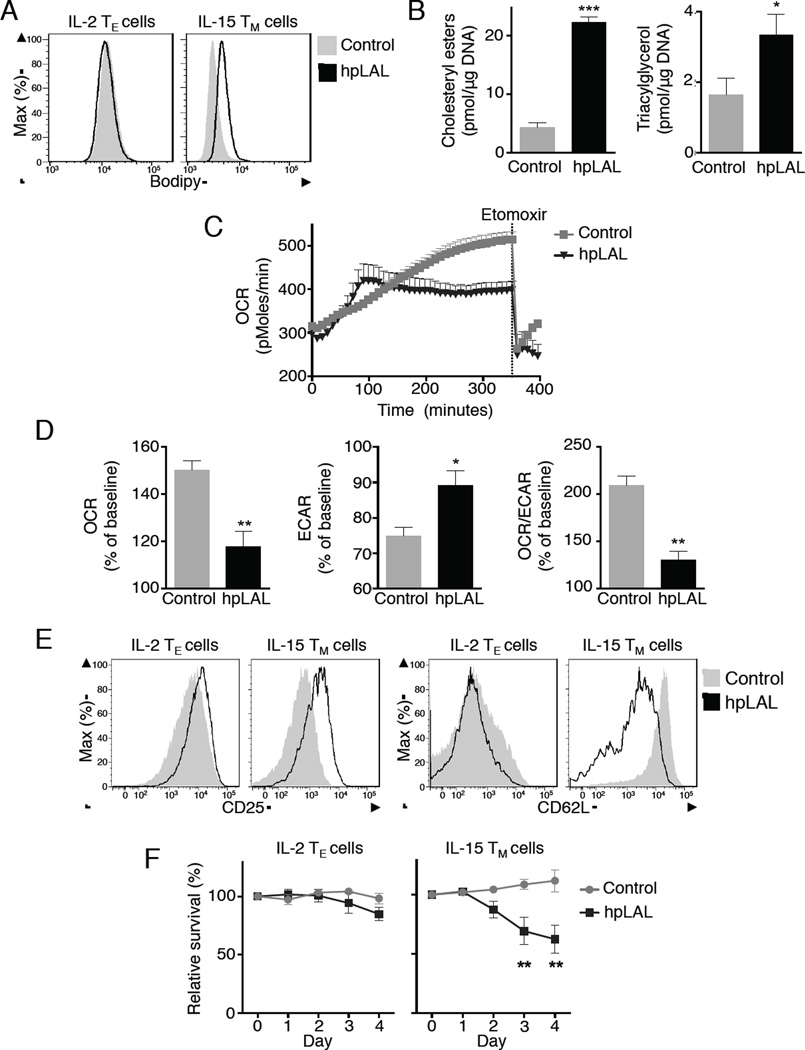
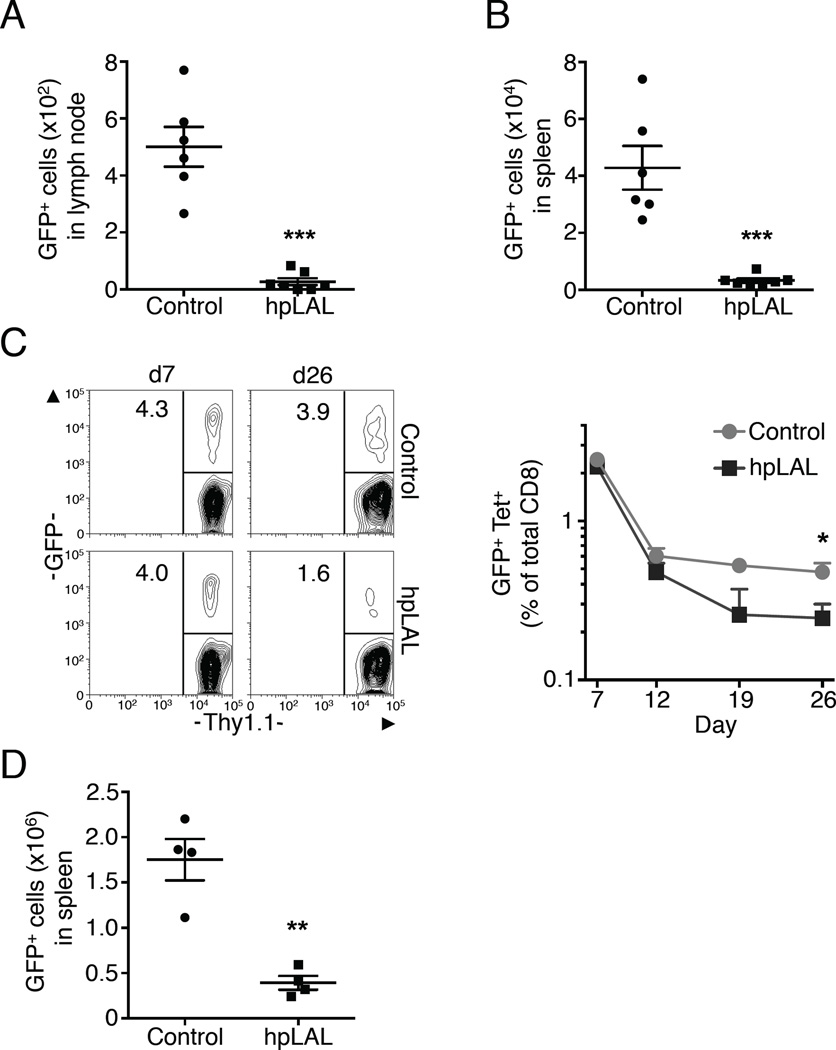
Generation of CD8(+) memory T cells requires metabolic reprogramming that is characterized by enhanced mitochondrial fatty-acid oxidation (FAO). However, where the fatty acids (FA) that fuel this process come from remains unclear. While CD8(+) memory T cells engage FAO to a greater extent, we found that they acquired substantially fewer long-chain FA from their external environment than CD8(+) effector T (Teff) cells. Rather than using extracellular FA directly, memory T cells used extracellular glucose to support FAO and oxidative phosphorylation (OXPHOS), suggesting that lipids must be synthesized to generate the substrates needed for FAO. We have demonstrated that memory T cells rely on cell intrinsic expression of the lysosomal hydrolase LAL (lysosomal acid lipase) to mobilize FA for FAO and memory T cell development. Our observations link LAL to metabolic reprogramming in lymphocytes and show that cell intrinsic lipolysis is deterministic for memory T cell fate.


Figures

Figure 1
Figure 1. Unlike CD8+ TE cells, CD8+ TM cells do not acquire substantial amounts of extracellular fatty acids
OT-I cells were injected i.v. into congenic recipients. Mice were infected with LmOVA to generate TE (7 days) and TM (≥ 21 days) cells, and peripheral blood was collected 1h after i.v. Bodipy FL C16 injection and uptake quantified by FACS. (A) Representative plots (histogram) and average MFI (bar graph) of Bodipy FL C16 in TE and TM KbOVA-specific CD8+ OT-I+ cells from 2 experiments (n=7-8 mice/group). Bar graphs show mean ± SEM, **p <0.01. (B) Representative plots (histogram) of Bodipy FL C16 MFI in polyclonal TE (CD44hi CD62Llo), TM (CD44hi CD62Lhi), and TN (CD44lo CD62Lhi) CD8+ T cells 7 days post-infection and average MFI (bar graph) of polyclonal CD8+ T cells from 2 experiments (n=9 mice/group). Bar graphs show mean ± SEM ***p <0.001. (C) OT-I cells were activated with OVA peptide and IL-2 for 3 days and subsequently cultured in IL-15 or IL-2 for 4 more days to generate IL-15 TM and IL-2 TE cells respectively. (D) OTI cells were incubated with Bodipy FL C16 on d4-7 of culture, and uptake was measured. MFIs were normalized to the daily MFI of IL-2 TE cells. Data from 3 experiments shown as mean ± SEM, *p <0.05 by one sample t-test. (E) CD36 expression on d7 IL-2 TE and IL-15 TM cells, or polyclonal T cells. Data represent 3 experiments. (F-H) Day 6 IL-2 TE or IL-15 TM cells were cultured overnight ± oleate then stained with Bodipy. (F) Representative plots showing Bodipy MFI and (G) average Bodipy MFI from 3 experiments show mean ± SEM, *p <0.05, **p <0.01. (H) Images showing Bodipy (green) and CD8 (red) represent 4 experiments. Scale bar = 2 µM (I) OT-I cells expressing a lipid droplet-targeting construct (LD-GFP) were cultured overnight ± oleate. Images show LD-GFP (green) and CD8 (red) and represent 2 experiments. (J) Cells were incubated with Bodipy-LDL or left unstained (Control), data represent 2 experiments.
Figure 2
Figure 2. Ultrastructure analysis reveals densely packed mitochondria in close proximity to ER in TM cells
EM images of mitochondria associated with ER from (A) TE and TM cells and (B) IL-2 TE and IL-15 TM cells; mitochondrion, red arrow; ER, blue arrow; electron dense structure, green arrow. Data represent ≥ 2 experiments.
Figure 3
Figure 3. Glucose fuels mitochondrial FAO and OXPHOS in IL-15 TM cells
(A) IL-2 TE and IL-15 TM cell survival (7-AAD exclusion) ± C75, shown as survival relative to vehicle (Veh.) treated cells. Data from 5 experiments show mean ± SEM, **p <0.01. (B) IL-2 TE proliferation in the presence of C75 or vehicle. Data represent 3 experiments. (C) OCR of IL-2 TE or IL-15 TM cells cultured in TCM (Control) and low glucose TCM (LG) was measured under basal conditions and in response to oligomycin (Oligo), FCCP, etomoxir (Eto) and rotenone + antimycin (Rot+Ant). Data represent 2 experiments. (D) Representative plot (histogram) and average MFI (bar graph) of 2-NBDG uptake in polyclonal TE and TM cells from 1 experiment (n=4 mice/group). Data in bar graph show mean ± SEM, ***p <0.001. (E) OCR represented as % of baseline for IL-15 TM cells cultured with AmA or vehicle (Control) measured in response to indicated drugs. Data represent 2 experiments. (F) OCR of IL-2 TE or IL-15 TM cells cultured in TCM (Control) and lipid depleted TCM (LD), measured under basal conditions and in response to indicated drugs. Data represent 2 experiments.
Figure 4
Figure 4. The lipid signature of TM cells suggests active lipolysis
(A-F) Lipids were quantified from d7 cultured IL-2 TE and IL-15 TM cells. Data represent 3 experiments shown as mean ± SEM, *p <0.05.
Figure 5
Figure 5. Lysosomes associate with intracellular neutral lipids during the TM cell transition in vitro
(A) Relative mRNA expression of LAL in d7 IL-2 TE and IL-15 TM cells. Data from 3 experiments shown as mean ± SEM, ***p <0.001. (B) LAL protein expression compared to β-Actin. Data represent 2 experiments. (C) Relative mRNA expression of LAL in TE and TM cells. Data from 3 experiments shown as mean ± SEM, *p <0.05. IL-2 TE and IL-15 TM cells were stained with LysoTracker (blue) and Bodipy (green) on d4 (D) or d7 (E) of culture. Scale bar = 2 µM. Data represent 3 experiments.
Figure 6
Figure 6. Lysosomal lipolysis metabolically programs CD8+ T cells toward the TM cell phenotype
IL-2 TE or IL-15 TM cells were transduced with retroviral vectors containing shRNA against luciferase (Control) or against LAL (hpLAL). (A) Cells were stained for neutral lipids with Bodipy. Data represent 3 experiments. (B) IL-15 TM cells were analyzed for lipid content by MS. Data from 3 experiments show mean ± SEM, *p <0.05, ***p <0.001. (C-E) On day 3 of culture, IL-2 TE cells were washed and resuspended in media with IL 15. OCR and ECAR were measured. (C) Representative plot showing OCR. (D) Relative change in OCR, ECAR and OCR/ECAR 5 hours after baseline, represented as % change from baseline. Data from 5 experiments show mean ± SEM, *p <0.05 or **p <0.01. (E) Expression of CD25 and CD62L on d7 IL-2 TE or IL-15 TM cells. Data represent 5 experiments. (F) Day 3 IL-2 TE cells were cultured in IL-2 or IL-15 and analyzed daily (d0-4) for survival (7AAD exclusion). Data represented as % survival relative to non-transduced cells. Data from 3 experiments shown as mean ± SEM, **p <0.01 by 2 way ANOVA.
Figure 7
Figure 7. T cell intrinsic lysosomal lipolysis supports CD8+ TM cell development after infection
(A-B) Congenic IL-2 TE cells were transduced with control or hpLAL and sorted on GFP. On d6 of culture, 2x10⁶ cells/mouse were injected i.v. and harvested from spleen or LN 2 days later. Data represent 3 experiments, shown as mean ± SEM, ***p <0.001. (C-E) Congenic OT-I control or hpLAL transduced cells were transferred into mice infected 1 day prior with LmOVA. (C-D) Blood was analyzed for CD8, KbOVA, Thy1.1, and GFP. (C) Data shown as % of total CD8+ (line graph); representative plots show % GFP+ of Thy 1.1+ donor cells. Data represent 2 experiments, *p <0.05. (D) Mice were challenged with LmOVA and 5 days later CD8+ KbOVA GFP+ cells from spleen were quantified. Data shown as mean ± SEM and represent 2 experiments, **p <0.01.

Comment in

  • T cell memory: Metabolic self-reliance.
    Minton K. Minton K. Nat Rev Immunol. 2014 Aug;14(8):518. doi: 10.1038/nri3721. Epub 2014 Jul 18. Nat Rev Immunol. 2014. PMID: 25033905 No abstract available.
  • Futility sustains memory T cells.
    Weinberg SE, Chandel NS. Weinberg SE, et al. Immunity. 2014 Jul 17;41(1):1-3. doi: 10.1016/j.immuni.2014.06.009. Immunity. 2014. PMID: 25035944 Free PMC article.

References

    1. Bensinger SJ, Bradley MN, Joseph SB, Zelcer N, Janssen EM, Hausner MA, Shih R, Parks JS, Edwards PA, Jamieson BD, Tontonoz P. LXR Signaling Couples Sterol Metabolism to Proliferation in the Acquired Immune Response. Cell. 2008;134:97–111. - PMC - PubMed
    1. Bowden KL, Bilbey NJ, Bilawchuk LM, Boadu E, Sidhu R, Ory DS, Du H, Chan T, Francis GA. Lysosomal Acid Lipase Deficiency Impairs Regulation of ABCA1 Gene and Formation of High Density Lipoproteins in Cholesteryl Ester Storage Disease. Journal of Biological Chemistry. 2011;286:30624–30635. - PMC - PubMed
    1. Brasaemle DL. Thematic review series: Adipocyte Biology. The perilipin family of structural lipid droplet proteins: stabilization of lipid droplets and control of lipolysis. Journal of Lipid Research. 2007;48:2547–2559. - PubMed
    1. Bulankina AV, Deggerich A, Wenzel D, Mutenda K, Wittmann JG, Rudolph MG, Burger KNJ, Höning S. TIP47 functions in the biogenesis of lipid droplets. Journal of Cell Biology. 2009;185:641–655. - PMC - PubMed
    1. Buzzai M, Bauer DE, Jones RG, DeBerardinis RJ, Hatzivassiliou G, Elstrom RL, Thompson CB. The glucose dependence of Akt-transformed cells can be reversed by pharmacologic activation of fatty acid [beta]-oxidation. Oncogene. 2005;24:4165–4173. - PubMed

Publication types

MeSH terms