Fine-scale genetic structure analyses suggest further male than female dispersal in mountain gorillas
- PMID: 25001262
- PMCID: PMC4113491
- DOI: 10.1186/1472-6785-14-21
Fine-scale genetic structure analyses suggest further male than female dispersal in mountain gorillas
Abstract
Background: Molecular studies in social mammals rarely compare the inferences gained from genetic analyses with field information, especially in the context of dispersal. In this study, we used genetic data to elucidate sex-specific dispersal dynamics in the Virunga Massif mountain gorilla population (Gorilla beringei beringei), a primate species characterized by routine male and female dispersal from stable mixed-sex social groups. Specifically, we conducted spatial genetic structure analyses for each sex and linked our genetically-based observations with some key demographic and behavioural data from this population.
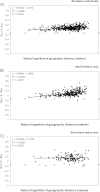
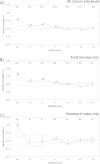
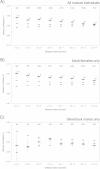
Results: To investigate the spatial genetic structure of mountain gorillas, we analysed the genotypes of 193 mature individuals at 11 microsatellite loci by means of isolation-by-distance and spatial autocorrelation analyses. Although not all males and females disperse, female gorillas displayed an isolation-by-distance pattern among groups and a signal of dispersal at short distances from their natal group based on spatial autocorrelation analyses. In contrast, male genotypes were not correlated with spatial distance, thus suggesting a larger mean dispersal distance for males as compared to females. Both within sex and mixed-sex pairs were on average genetically more related within groups than among groups.
Conclusions: Our study provides evidence for an intersexual difference in dispersal distance in the mountain gorilla. Overall, it stresses the importance of investigating spatial genetic structure patterns on a sex-specific basis to better understand the dispersal dynamics of the species under investigation. It is currently poorly understood why some male and female gorillas disperse while others remain in the natal group. Our results on average relatedness within and across groups confirm that groups often contain close relatives. While inbreeding avoidance may play a role in driving female dispersal, we note that more detailed dyadic genetic analyses are needed to shed light on the role of inbreeding avoidance as an ultimate cause of female dispersal in mountain gorillas.
Figures


Similar articles
-
Sex-biased dispersal in western lowland gorillas (Gorilla gorilla gorilla).Mol Ecol. 2007 Jun;16(11):2247-59. doi: 10.1111/j.1365-294X.2007.03286.x. Mol Ecol. 2007. PMID: 17561888
-
Potential for female kin associations in wild western gorillas despite female dispersal.Proc Biol Sci. 2007 Sep 7;274(1622):2179-85. doi: 10.1098/rspb.2007.0407. Proc Biol Sci. 2007. PMID: 17609183 Free PMC article.
-
Fine-scale genetic structure analyses reveal dispersal patterns in a critically endangered primate, Trachypithecus leucocephalus.Am J Primatol. 2017 May;79(5). doi: 10.1002/ajp.22635. Epub 2017 Jan 18. Am J Primatol. 2017. PMID: 28100010
-
Recent divergences and size decreases of eastern gorilla populations.Biol Lett. 2014 Nov;10(11):20140811. doi: 10.1098/rsbl.2014.0811. Biol Lett. 2014. PMID: 25376805 Free PMC article.
-
Comparative genomic analyses provide new insights into evolutionary history and conservation genomics of gorillas.BMC Ecol Evol. 2024 Jan 26;24(1):14. doi: 10.1186/s12862-023-02195-x. BMC Ecol Evol. 2024. PMID: 38273244 Free PMC article. Review.
Cited by
-
Ghost admixture in eastern gorillas.Nat Ecol Evol. 2023 Sep;7(9):1503-1514. doi: 10.1038/s41559-023-02145-2. Epub 2023 Jul 27. Nat Ecol Evol. 2023. PMID: 37500909 Free PMC article.
-
No evidence for female kin association, indications for extragroup paternity, and sex-biased dispersal patterns in wild western gorillas.Ecol Evol. 2021 May 25;11(12):7634-7646. doi: 10.1002/ece3.7596. eCollection 2021 Jun. Ecol Evol. 2021. PMID: 34188840 Free PMC article.
-
Deconstructing isolation-by-distance: The genomic consequences of limited dispersal.PLoS Genet. 2017 Aug 3;13(8):e1006911. doi: 10.1371/journal.pgen.1006911. eCollection 2017 Aug. PLoS Genet. 2017. PMID: 28771477 Free PMC article.
-
How can non-human primates inform evolutionary perspectives on female-biased kinship in humans?Philos Trans R Soc Lond B Biol Sci. 2019 Sep 2;374(1780):20180074. doi: 10.1098/rstb.2018.0074. Epub 2019 Jul 15. Philos Trans R Soc Lond B Biol Sci. 2019. PMID: 31303156 Free PMC article. Review.
-
Mountain gorillas maintain strong affiliative biases for maternal siblings despite high male reproductive skew and extensive exposure to paternal kin.Elife. 2022 Sep 22;11:e80820. doi: 10.7554/eLife.80820. Elife. 2022. PMID: 36134889 Free PMC article.
References
-
- Clutton-Brock TH. Female transfer and inbreeding avoidance in social mammals. Nature. 1989;337:70–72. - PubMed
-
- Storz JF. Genetic consequences of mammalian social structure. J Mammal. 1999;80:553–569.
-
- Clutton-Brock TH, Lukas D. The evolution of social philopatry and dispersal in female mammals. Mol Ecol. 2012;21:472–492. - PubMed
-
- Clutton-Brock TH. Mammalian mating systems. Proc R Soc London Ser B Biol Sci. 1989;236:339–372. - PubMed
-
- Hamilton WD. The genetical evolution of social behaviour. I. J Theor Biol. 1964;7:1–16. - PubMed
Publication types
MeSH terms
LinkOut - more resources
Full Text Sources
Other Literature Sources

