. 2014 Aug;24(8):959-76.
doi: 10.1038/cr.2014.89. Epub 2014 Jul 8.

Regulation of EGFR nanocluster formation by ionic protein-lipid interaction

Affiliations

Regulation of EGFR nanocluster formation by ionic protein-lipid interaction

Ye Wang et al. Cell Res. 2014 Aug.

Abstract

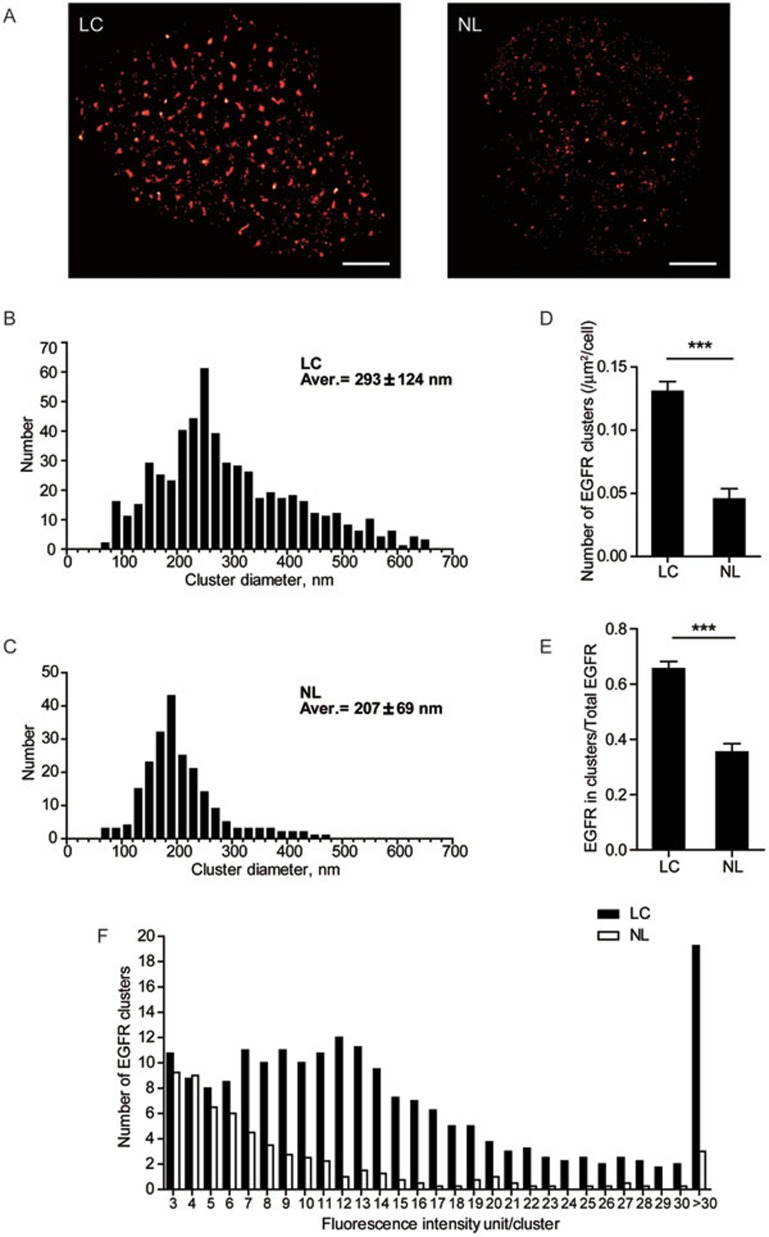
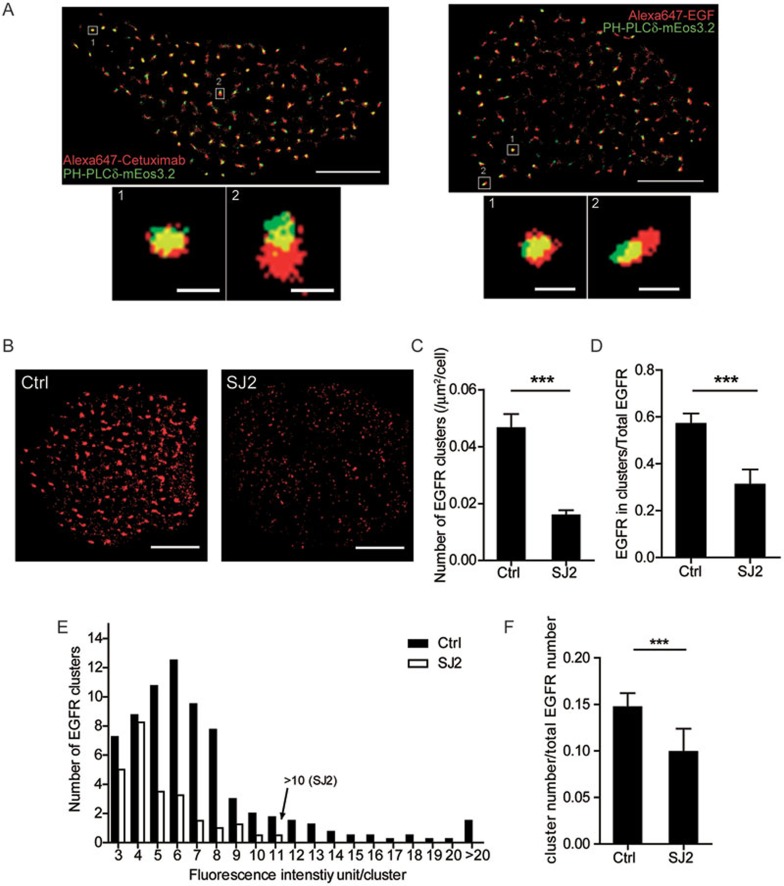
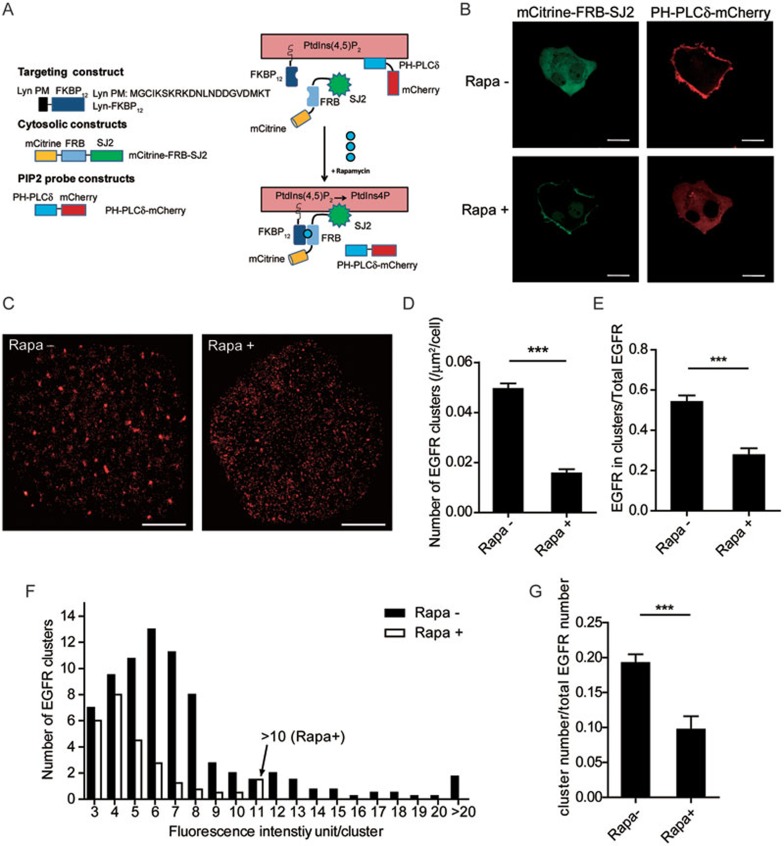
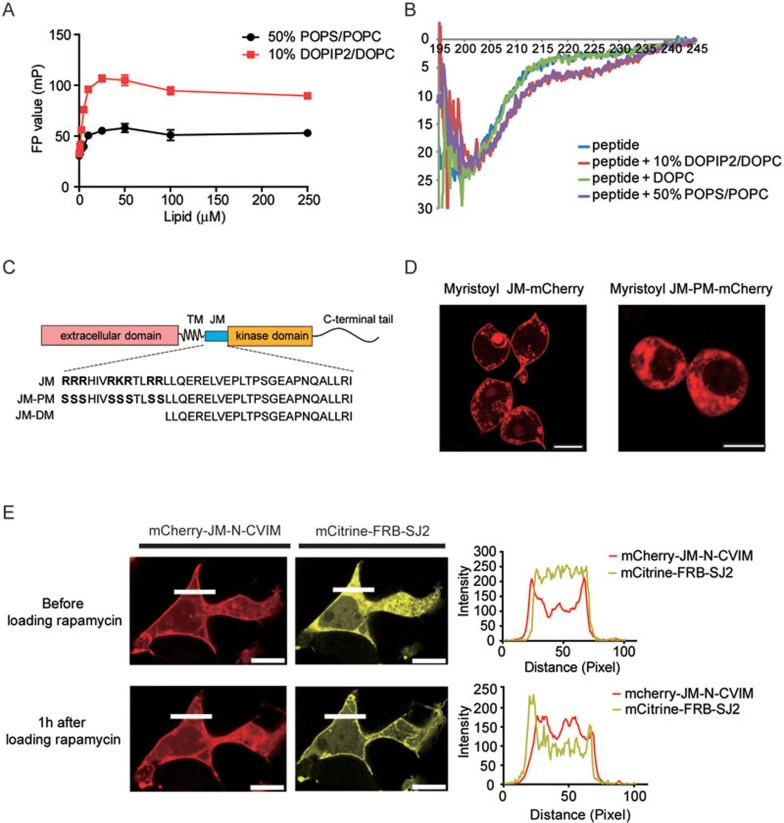
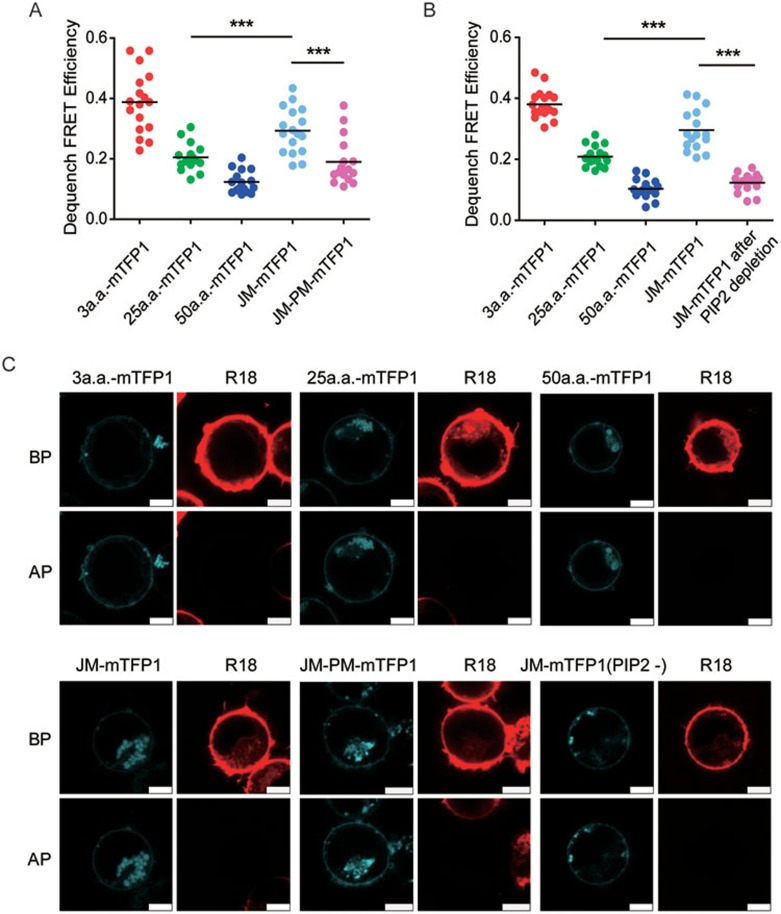
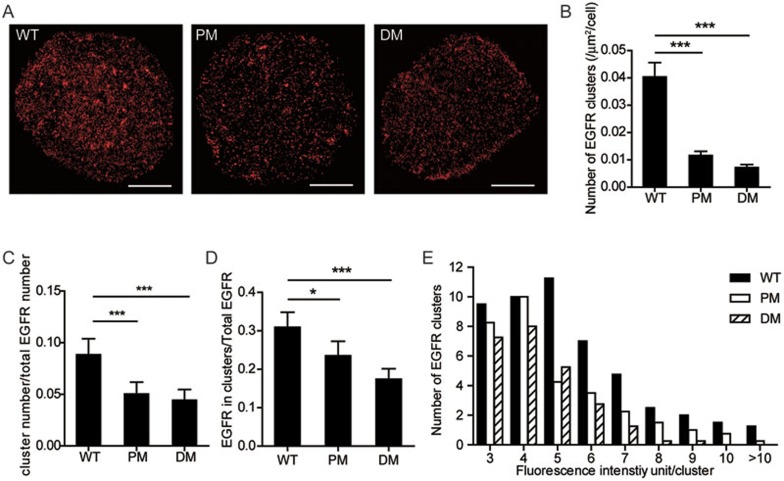
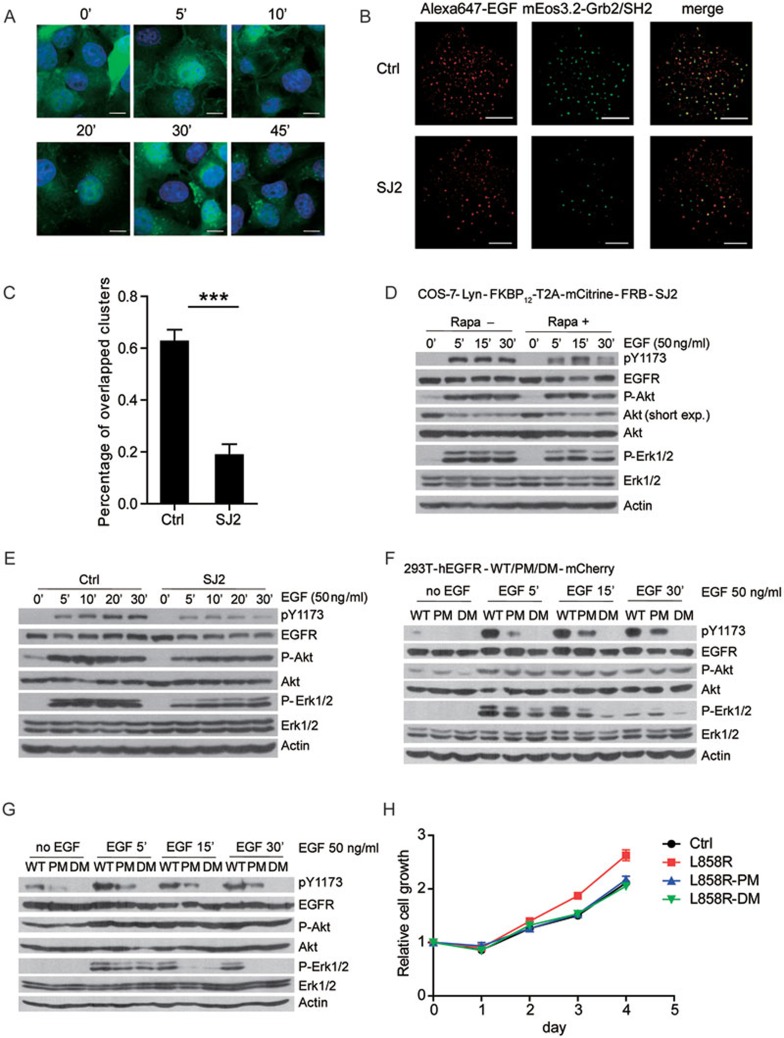
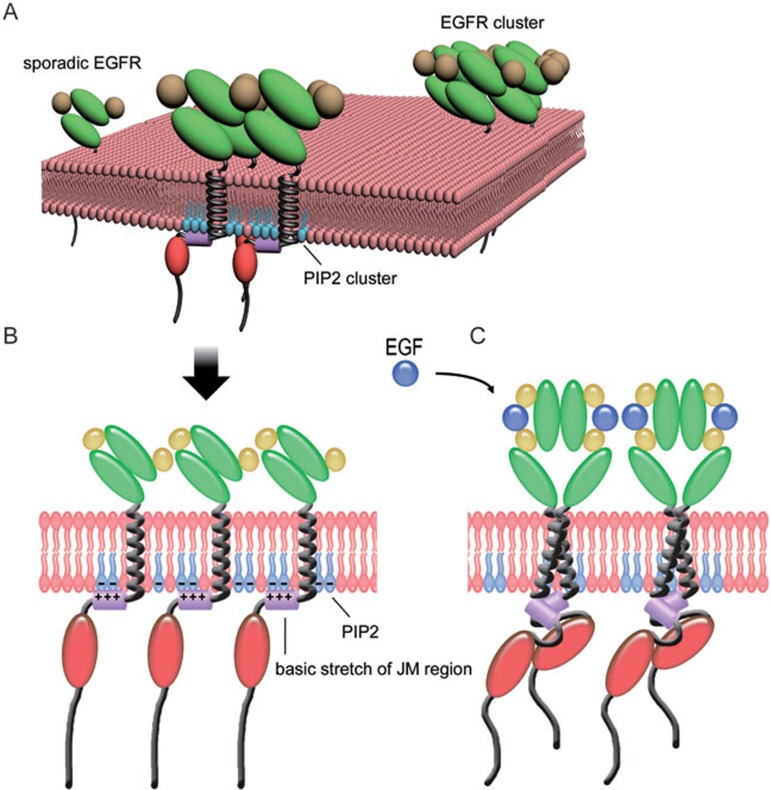
The abnormal activation of epidermal growth factor receptor (EGFR) is strongly associated with a variety of human cancers but the underlying molecular mechanism is not fully understood. By using direct stochastic optical reconstruction microscopy (dSTORM), we find that EGFR proteins form nanoclusters in the cell membrane of both normal lung epithelial cells and lung cancer cells, but the number and size of clusters significantly increase in lung cancer cells. The formation of EGFR clusters is mediated by the ionic interaction between the anionic lipid phosphatidylinositol-4,5-bisphosphate (PIP2) in the plasma membrane and the juxtamembrane (JM) region of EGFR. Disruption of EGFR clustering by PIP2 depletion or JM region mutation impairs EGFR activation and downstream signaling. Furthermore, JM region mutation in constitutively active EGFR mutant attenuates its capability of cell transformation. Collectively, our findings highlight the key roles of anionic phospholipids in EGFR signaling and function, and reveal a novel mechanism to explain the aberrant activation of EGFR in cancers.


Figures

Figure 1
Figure 1
EGFR forms more clusters with bigger size in the plasma membrane of lung cancer cells compared with normal lung epithelial cells. (A) Reconstructed dSTORM images of Alexa647-Cetuximab-labeled EGFR in the plasma membrane of lung cancer cells (LC) and normal lung epithelial cells (NL). Scale bar, 10 μm. (B, C) Size distribution of EGFR clusters on cell surface of LC (B) and NL (C). (D) Surface density of EGFR clusters for LC and NL. (E) Percentage of EGFR proteins in cluster on cell surface of LC and NL. (F) Average number of clusters containing different fluorescence intensity unit of EGFR proteins on cell surface of LC and NL. All the cells were labeled with Alexa647-Cetuximab for dSTORM analyses. All error bars denote SD. ***P < 0.001, two-tailed unpaired t-test.
Figure 2
Figure 2
Constitutive PIP2 depletion disrupts the EGFR clustering in the plasma membrane. (A) Two-color dSTORM and PALM images of EGFR labeled with Alexa647-Cetuximab (red, left) or Alexa647-EGF (red, right) and PIP2 labeled with PH-PLCδ-mEos3.2 (green) in COS-7 cells. Scale bar, 10 μm. Inset 1 and 2 show the complete and partial overlap of EGFR clusters and PIP2 clusters, respectively. Scale bar, 200 nm. (B) Reconstructed dSTORM images of control COS-7 cells (Ctrl) and SJ2-mCitrine-expressing COS-7 cells (SJ2) labeled with Alexa647-Cetuximab. Scale bar, 10 μm. (C) Surface density of EGFR clusters in Ctrl and SJ2 COS-7 cells. (D) Percentage of EGFR proteins in cluster on the surface of Ctrl and SJ2 COS-7 cells. (E) Average number of clusters containing different amount of EGFR proteins on the surface of Ctrl and SJ2 COS-7 cells. (F) The number of EGFR clusters on the surface of Ctrl and SJ2 COS-7 cells, which is normalized by corresponding total amount of surface EGFR protein. All error bars denote SD. ***P < 0.001, two-tailed unpaired t-test.
Figure 3
Figure 3
Inducible depletion of PIP2 significantly impairs the EGFR clustering in the plasma membrane. (A) Schematic diagram of the components (left) and principle (right) of inducible PIP2 depletion system. (B) Validation of the system in COS-7 cells visualized by laser scanning confocal microscope. Scale bar, 20 μm. (C) dSTORM images of COS-7 cells transfected with the inducible PIP2 depletion system before (Rapa−) and after (Rapa+) rapamycin treatment. Scale bar, 10 μm. (D) Surface density of EGFR clusters in COS-7 cells before (Rapa−) and after (Rapa+) rapamycin treatment. (E) Percentage of EGFR proteins clustering on the surface of COS-7 cells before (Rapa−) and after (Rapa+) rapamycin treatment. (F) Average number of clusters containing different amount of EGFR proteins on the surface of COS-7 cells before (Rapa−) and after (Rapa+) rapamycin treatment. (G) The number of EGFR clusters on the surface of COS-7 cells before (Rapa−) and after (Rapa+) rapamycin treatment, which is normalized by corresponding total amount of surface EGFR protein. All the cells were labeled with Alexa647-Cetuximab for dSTORM analyses. All error bars denote SD. ***P < 0.001, two-tailed unpaired t-test.
Figure 4
Figure 4
The JM region of EGFR ionically binds to the anionic phospholipid PIP2 in vitro and in vivo. (A) Analysis of the association of JM peptide with the membrane bilayer by fluorescence polarization (FP) technique. The FP value increased gradually with the increase of lipid concentration. (B) Analysis of the secondary structural change of JM peptide by a far UV CD experiment. Free JM displayed as an unstructured flexible peptide in solution, while the presence of 50% POPS/POPC or 10% DOPIP2/DOPC bicelles induced partial helical folding of JM. (C) Schematic diagram of two EGFR JM region mutations. JM-PM, point mutation; JM-DM, deletion mutation. (D) Cellular localization of N-myristoyl JM peptide or JM-PM peptide fused with mCherry protein in 293T cells visualized by laser scanning confocal microscopy. Scale bar, 10 μm. (E) The location of mCherry-JM-N-CVIM fusion protein and mCitrine-FRB-SJ2 were scanned by confocal microscopy in 293T cells transiently transfected with corresponding constructs before and after loading rapamycin and incubating at 37 °C for 1 h (left). The fluorescence intensity distributions along the white lines were shown on the right before and after rapamycin treatment. Scale bar, 10 μm.
Figure 5
Figure 5
The JM region binds to PIP2 in the plasma membrane via ionic interaction. (A, B) FRET efficiencies were measured between mTFP1 and the membrane dye R18 by dequenching approach in living Jurkat cells. 3a.a.-mTFP1, 25a.a.-mTFP1 and 50a.a.-mTFP1 served as control constructs. The measured FRET efficiencies were compared between wild-type JM (JM-mTFP1) and mutated JM (JM-PM-mTFP1) in A, or between the conditions before and after PIP2 depletion in B. (C) R18-labeled cells were imaged in both channels and the acceptor R18 was then photobleached to release the quenched fluorescence. BP, before photobleaching; AP, after photobleaching. Scale bar, 5 μm. The FRET efficiencies were measured for 16–18 cells per condition. Each dot represents the FRET value from one individual cell. Unpaired two tailed Student's t-test was used for the statistical analysis.
Figure 6
Figure 6
The JM region regulates the EGFR clustering in the plasma membrane. (A) dSTORM images of 293T cells expressing comparable levels of exogenous full-length EGFR-WT, PM or DM. Scale bar, 10 μm. (B) Surface density of EGFR clusters in 293T cells expressing EGFR-WT, PM or DM. (C) The number of EGFR clusters on the surface of 293T cells expressing EGFR-WT, PM or DM, which is normalized by corresponding total amount of surface EGFR protein. (D) Percentage of EGFR proteins clustering on cell surface of 293T expressing EGFR-WT, PM or DM. (E) Average number of clusters containing different amount of EGFR proteins on cell surface of 293T expressing EGFR-WT, PM or DM. All the cells were labeled with Alexa647-Cetuximab for dSTORM analyses. All error bars denote SD. *P < 0.05, ***P < 0.001, two-tailed unpaired t-test.
Figure 7
Figure 7
The JM-PIP2 interaction regulates the EGFR activation, signaling and biological function. (A) Cellular location of mEos3.2-Grb2/SH2 (green) in COS-7 cells after different time of EGF treatment visualized by laser scanning confocal microscopy. Scale bar, 10 μm. (B) Two-color PALM and dSTORM images of exogenous mEos3.2-Grb2/SH2 (green) and endogenous EGFR labeled with Alexa647-EGF (red) in COS-7 cells with (SJ2) or without (Ctrl) SJ2 expression after 10 min of Alexa647-EGF treatment at 37 °C. Scale bar, 10 μm. (C) Percentage of colocalized mEos3.2-Grb2/SH2 clusters and EGFR clusters at the plasma membrane of COS-7-Ctrl or COS-7-SJ2 cells. Error bars denote SD. ***P < 0.001, two-tailed unpaired t-test. (D) Western blot analysis of EGFR activation and its downstream signal transduction in COS-7 cells stably expressing Lyn-FKBP12-T2A-mCitrine-FRB-SJ2 in response to EGF stimulation (50 ng/ml) before (Rapa−) or after (Rapa+) rapamycin treatment. (E) Western blot analysis of the effect of SJ2 constitutive expression on the activation of endogenous EGFR and its downstream signaling in COS-7 cells. (F, G) Western blot analyses of EGFR activation and its downstream signal transduction in 293T cells stably (F) or transiently (G) expressing exogenous wild-type (WT) or mutated full-length EGFR (EGFR-PM, EGFR-DM). (H) Cell proliferation of Ba/F3 cells stably expressing EGFR-L858R or EGFR-L858R with mutated JM region (L858R-PM or L858R-DM) in the absence of IL-3 was analyzed. Error bars denote SD.
Figure 8
Figure 8
A schematic illustration of ionic protein-lipid interaction-mediated EGFR membrane clustering model. (A) On the cell surface, EGFR can form clusters comprised of 3–5 proteins, partially overlapping with the PIP2 clusters in the plasma membrane, or distributes sporadically. (B) The N-terminus of the JM region of EGFR binds to the anionic PIP2 clusters in the inner-leaflet of the plasma membrane through ionic interaction, which facilitates EGFR aggregation and cluster formation. (C) This special distribution pattern makes EGFR ready for a quick response to ligand stimulation and a strong activation of downstream signaling.

Similar articles

Cited by

References

    1. Hynes NE, Lane HA. ERBB receptors and cancer: the complexity of targeted inhibitors. Nat Rev Cancer. 2005;5:341–354. - PubMed
    1. Citri A, Yarden Y. EGF-ERBB signalling: towards the systems level. Nat Rev Mol Cell Biol. 2006;7:505–516. - PubMed
    1. Schlessinger J. Ligand-induced, receptor-mediated dimerization and activation of EGF receptor. Cell. 2002;110:669–672. - PubMed
    1. Jura N, Endres NF, Engel K, et al. Mechanism for activation of the EGF receptor catalytic domain by the juxtamembrane segment. Cell. 2009;137:1293–1307. - PMC - PubMed
    1. Endres NF, Das R, Smith AW, et al. Conformational coupling across the plasma membrane in activation of the EGF receptor. Cell. 2013;152:543–556. - PMC - PubMed

Publication types

MeSH terms