. 2014 Jul 8:5:4259.
doi: 10.1038/ncomms5259.

IL-23 promotes TCR-mediated negative selection of thymocytes through the upregulation of IL-23 receptor and RORγt

Affiliations

IL-23 promotes TCR-mediated negative selection of thymocytes through the upregulation of IL-23 receptor and RORγt

Hao Li et al. Nat Commun. .

Abstract

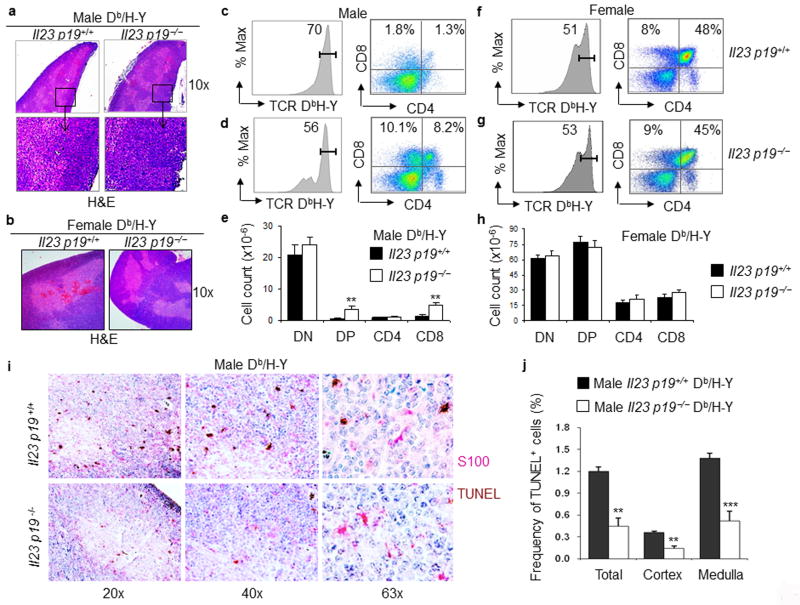
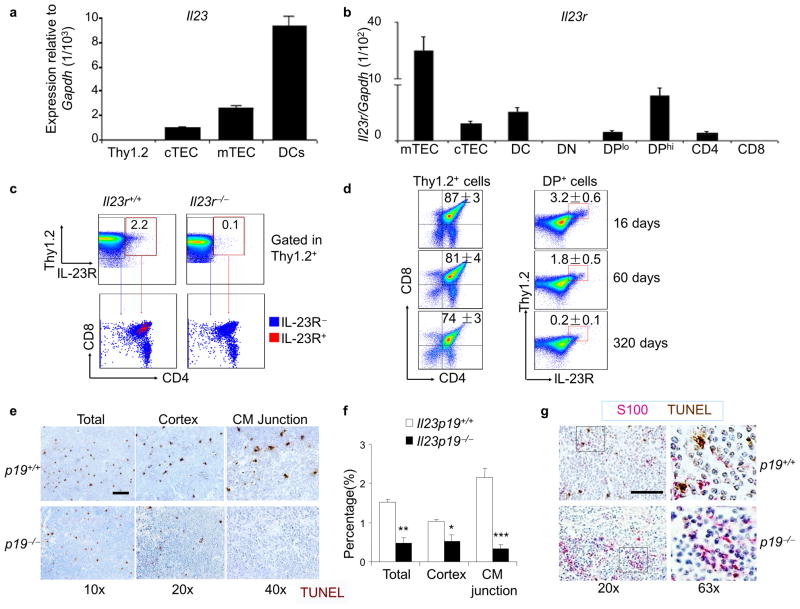
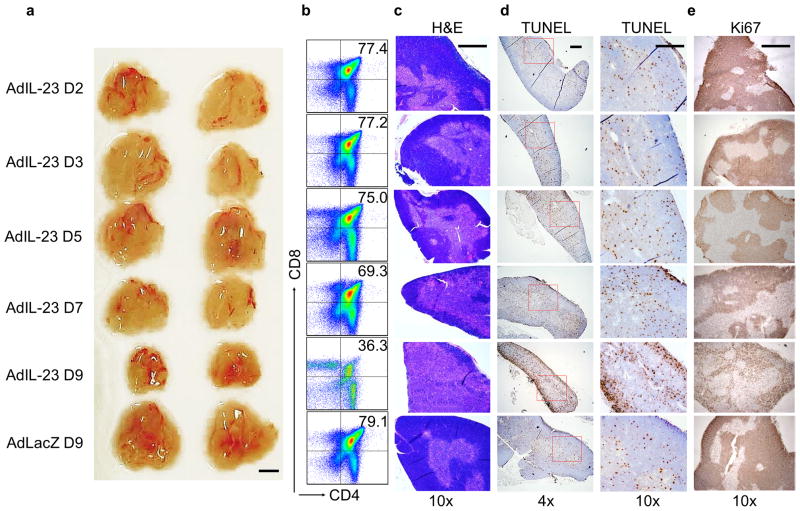
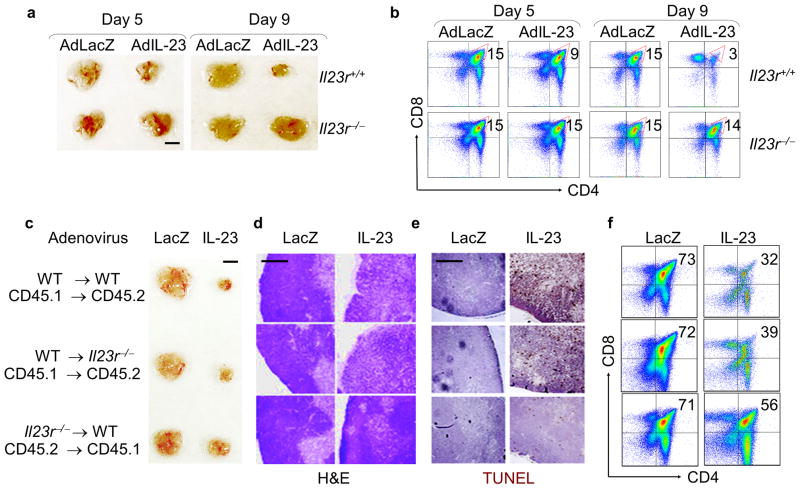
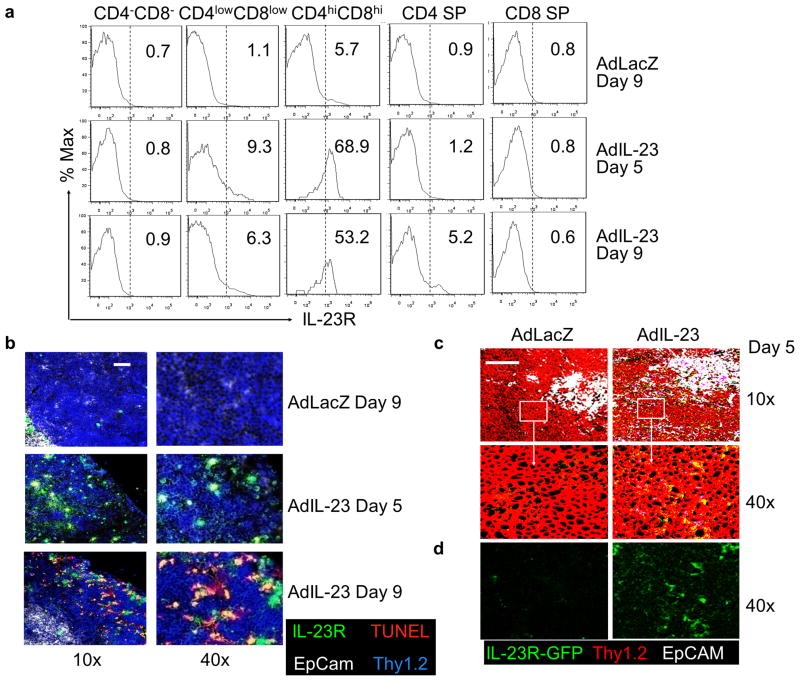
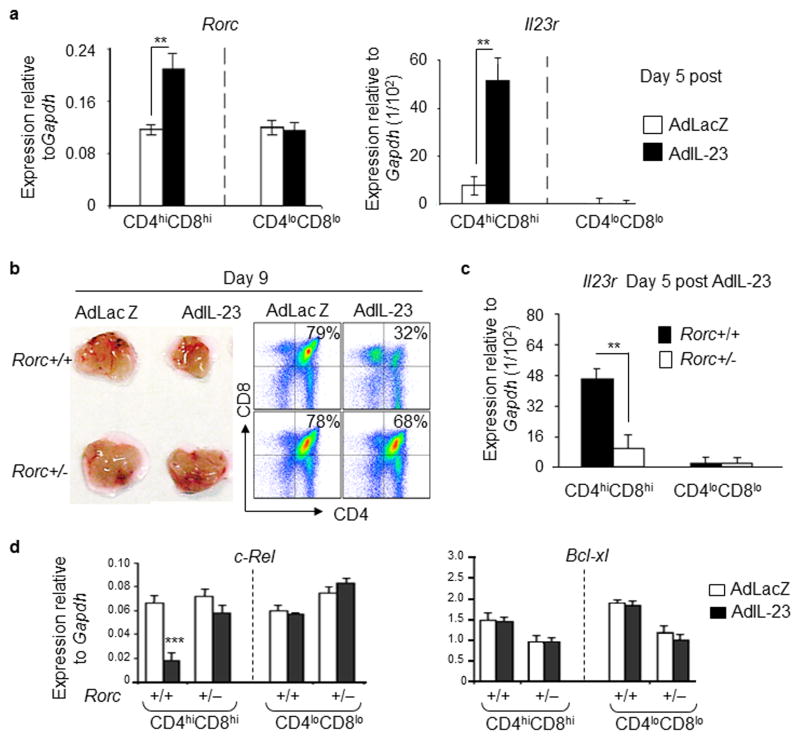
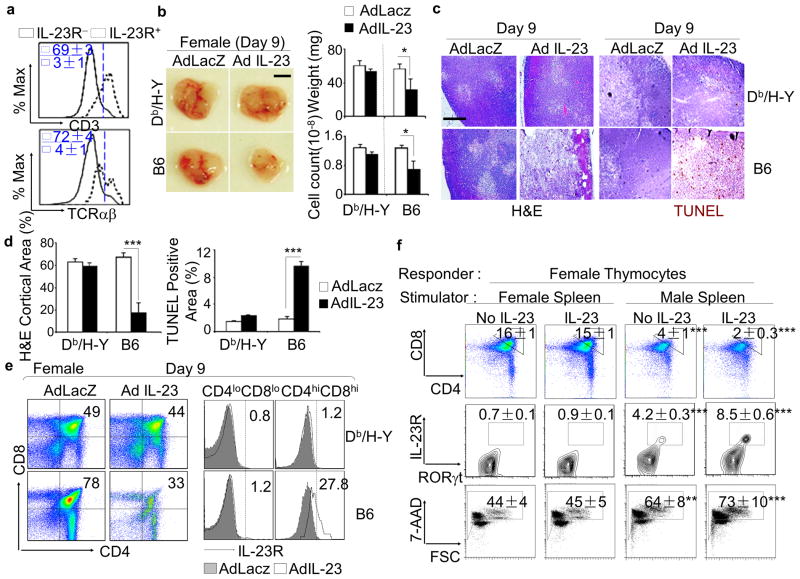
Transient thymic involution is frequently found during inflammation, yet the mode of action of inflammatory cytokines is not well defined. Here we report that interleukin-23 (IL-23) production by the thymic dendritic cells (DCs) promotes apoptosis of the CD4(hi)CD8(hi) double-positive (DP) thymocytes. A deficiency in IL-23 signalling interferes with negative selection in the male D(b)/H-Y T-cell receptor (TCR) transgenic mice. IL-23 plus TCR signalling results in significant upregulation of IL-23 receptor (IL-23R) expressed predominantly on CD4(hi)CD8(hi)CD3(+)αβTCR(+) DP thymocytes, and leads to RORγt-dependent apoptosis. These results extend the action of IL-23 beyond its peripheral effects to a unique role in TCR-mediated negative selection including elimination of natural T regulatory cells in the thymus.


Conflict of interest statement

Competing financial interests: The authors declare no competing financial interests.

Figures

Figure 1
Figure 1. Decreased thymic negative selection in Il23 p19−/− mice
(a) H&E staining of thymus from the indicated male mice. Enlarged images of the outlined area from upper images are shown below. (b) H&E staining of thymus from the indicated female mice. The object lens used to acquire the images is shown. Scale bars in (a) and (b): 300 μm. (c–h) Flow cytometry analysis of the frequency of H-Y TCR+ thymocytes and the distribution of CD4/CD8 in H-Y TCR+ thymocytes in (c) male Il23 p19+/+ Tg, (d) male Il23 p19−/− Tg, (f) female Il23 p19+/+ Tg and (g) female Il23 p19−/− Tg mice. In each group, all samples were gated first on Thy1.2+ cells. Numbers shown within each quadrant indicate the percent cells in the quadrant. Cell counts of the indicated populations of thymocytes (e, h). All populations were gated within the TCR Db/H-Y+ thymocytes. All results shown were calculated based on the percentage of each subpopulation of thymocytes multiplied by the total thymocyte count multiplied by 10−6. (i) Immunohistochemistry staining of thymic DCs (S100+, magenta) and apoptotic cells (TUNEL+, dark brown). The object lens used to acquire each panel of image is shown at the bottom. Scale bar: 100 μm. (j) The percentage of TUNEL+ cells at the indicated thymic region was quanttated in five randomly chosen microscopic areas from each section. All results represent the mean ± SEM (N=2–3 mice per group for 3 independent experiments; ** p<0.01 and *** p<0.005 between p19 Il23+/+ Db/H-Y Tg male and p19 Il23−/− Db/H-Y Tg male mice).
Figure 2
Figure 2. Decreased apoptosis in thymus of Il23 p19−/− mice
(a, b) qRT-PCR analysis of Il23 (a) and Il23r (b) in the indicated thymic subpopulations of 2mo-old B6 mice. Data are representative of two independent experiments (mean ± SEM, N=2–3 mice per experiment). (c) Flow cytometry analysis of IL-23R+ thymocyte subpopulation distribution. Thymocytes were gated on Thy1.2+IL-23R+ or Thy1.2+IL-23R separately, each population was analyzed for expression of CD4 and CD8. (d) Flow cytometry analysis of IL-23R expression in CD4+CD8+ DP thymocyte from mice of the indicated ages. Thymocytes were gated on Thy1.2+ population and were analyzed for expression of CD4 and CD8 (left). Cells within the DP Thy1.2+ subpopulation were analyzed for expression of IL-23R (right). (e) In situ TUNEL staining on thymus sections of Il23 p19+/+ or Il23 p19−/− C57BL/6J mouse. The magnification of the objective lens used for each panel is shown in the bottom. (f) BioQuant® image analysis on the percentage of TUNEL+ cells. Five microscopic areas were randomly chosen for the quantitation of each section. Data in (c)–(f) are representative of three independent experiments (mean ± SEM, N=2–3 mice per group ; * p<0.05, ** p<0.01, *** p<0.005 between Il23 p19+/+ and Il23 p19−/− mice). (g) In situ staining of thymic DCs and apoptotic thymocytes using S100 (magenta) and TUNEL staining (brown), respectively. The magnification of the objective lens used for each panel is shown below the images. Scale bar: 100 μm, applies to all panels.
Figure 3
Figure 3. Delayed apoptosis induced by IL-23 in the thymus
C57BL/6 mice were injected with either AdIL-23 or AdLacZ. At the indicated day (D), mice were sacrificed. (a) Gross anatomical images of representative thymi from each group of mice. Scale bars: 3.0 mm. (b) Flow cytometry analysis of CD4 and CD8 expression on Thy1.2+ cells and the percent of CD4+CD8+ cells is shown. (c) In situ H&E staining of a representative thymus section. (d) In situ TUNEL staining (dark brown) of a representative thymus section. (e) In situ Ki67 staining (dark brown) of a representative thymus section. The magnification of objective lens used is shown below the images. N=4–5 mice per group for 3 independent experiments. Scale bars in (c), (d) and (e): 300 μm.
Figure 4
Figure 4. Induction of IL-23R for IL-23 induced thymocyte apoptosis
(a, b) Il23r+/+ and Il23r −/− mice were administered with either AdIL-23 or AdLacZ. At the indicated time, mice were sacrificed. (a) Gross anatomical images of representative thymi from each group of mice. (b) Flow cytometry analysis of CD4 and CD8 expression on Thy1.2+ cells and the percent of CD4+CD8+ cells is shown. (c, d, e, f) Bone marrow (BM) reconstitution was carried out in the indicated 3 groups of donor/recipient chimeric mice. Recipient mice were administered with either AdIL-23 or AdLacZ 40 days later. Mice were sacrificed after 9 days. (c) Gross anatomical images of representative thymi. (d) In situ H&E staining of a representative thymus section. (e) In situ TUNEL staining (dark brown) of a representative thymus section. (f) Flow cytometry analysis of CD4 and CD8 expression on Thy1.2+ cells and the percent of CD4+CD8+ cells is shown. N=3 mice per group for 2 independent experiments. Scale bars in (a) and (c): 3.0 mm; Scale bars in (d) and (e): 300 μm.
Figure 5
Figure 5. IL-23 upregulates IL-23R to further promote IL-23-induced apoptosis
(a) Flow cytometry analysis of IL-23R on the indicated thymocyte populations from WT B6 mice at the indicated times after Ad virus administration. The percent of IL-23R+ cells is shown. (b) Immunofluorescent assessment of IL-23R expression by anti-IL-23R (green) and apoptosis (TUNEL, red) of thymic sections from the indicated mice. Sections were costained with A647 anti-CD90.2 (Blue) and A555 anti-EpCAM (white). Magnification is shown below the images. (c) Immunofluorescent assessment of IL-23R-GFP expression (green) on thymus sections obtained from heterozygous Il23r+/−-GFP KI mice 5 days after either AdLacZ or AdIL-23 administration. Sections were costained with anti-CD90.2 (red) and anti-EpCAM (white). Magnification is indicated to the right of the images. (d) A single green channel higher power view of the outlined area from panel c. N=4–5 mice per group for 3 independent experiments. Scale bar: 50 μm, applies to all panels.
Figure 6
Figure 6. CD4hiCD8hi DP thymocytes are targets of IL-23R-RORγt mediated apoptosis
AdLacZ or AdIL-23 was administered to WT (Rorc+/+) or Rorc+/ mice. (a) Real time qRT-PCR analysis of Rorc and Il23r on the indicated thymocytes of Rorc+/+ mice at day 5. (b) Left: Gross anatomic images showing the size of a representative thymus of WT (Rorc+/+) or Rorc+/ mice at day 9. Right: Flow cytometry analysis of CD4 and CD8 on total thymocytes (Thy1.2+). The frequency of CD4+CD8+ cells within total Thy1.2+ thymocytes is indicated. Scale bar: 3.0 mm. (c) qRT-PCR analysis of Il23r on the indicated thymocyte subpopulations from the indicated mouse strains at day 5. (d) qRT-PCR analysis of the expression of c-Rel and Bcl-xl in the indicated thymocyte subpopulations at day 5. Data in (a)–(d) are representative of three independent experiments (mean ± SEM, N=3–5 mice per group; ** p<0.01, *** p<0.005 between AdLacZ and AdIL-23 treated or Rorc+/ and Rorc+/+ mice).
Figure 7
Figure 7. Antigen activation initiates the expression of IL-23R on CD4hiCD8hi DP thymocytes
(a) Flow cytometry analysis of the expression of αβTCR and CD3ε on IL-23R+CD4+CD8+ or IL-23R CD4+CD8+ thymocytes from naïve C57L/B6J mice. The percentage of αβTCR+ or CD3ε+cells in the indicated population is shown. (b–e) Female Db/H-Y TCR Tg mice and female C57L/B6J mice were injected with either AdIL-23 or AdLacZ. Mice were sacrificed at day 9. (b) Left: Gross anatomic images showing the size of a representative thymus of the indicated mouse strains. Right: The weight and cellularity are shown. Scale bars: 3.0 mm. (c) In situ H&E (left) and In situ TUNEL staining (dark brown) (right) of a representative thymus section from the indicated group. The magnification of objective lens is 10x. Scale bars: 300 μm. (d) BioQuant quantitation of the frequency of thymic cortical area (left) or the frequency of TUNEL positive area (right) from ten randomly chosen areas. The results represent mean ± SEM (N=2–3 per group for 2 independent experiments, * p<0.05, ** p<0.01, *** p<0.005 for the indicated sample compared to AdLacZ injected group). (e) Left: Flow cytometry analysis of CD4 and CD8 expression on Thy1.2+ cells in the indicated group. The percent of CD4+CD8+ cells is shown. Right: Flow cytometry analysis of IL-23R on CD4loCD8lo and CD4hiCD8hi thymocytes. The percentage of IL-23R+ cells is indicated. (f) Thymocytes from female Db/H-Y mice were cocultured in vitro with irradiated female or male splenocytes from Thy1.1 C57BL/6 in the presence or absence of exogenous mouse recombinant IL-23. Top: Flow cytometry analysis of CD4 and CD8 expression on Thy1.2+ cells in the indicated group. The percent of CD4hiCD8hi cells is shown; Middle: The expression of IL-23R and RORγt on gated Thy1.2+CD4+CD8+ cells is shown; Bottom: Analysis of apoptosis (7-AAD) in Thy1.2+CD4+CD8+ cells. The percent of apoptotic cells is shown (N=3–4 mice per group for 2 independent experiments; * p<0.05, ** p<0.01, *** p<0.005 between thymocytes stimulated with female spleen cells in the absence of IL-23 compared to the indicated group).

Similar articles

Cited by

References

    1. Saito T, Watanabe N. Positive and negative thymocyte selection. Crit Rev Immunol. 1998;18:359–370. - PubMed
    1. Bouvier G, et al. Deletion of the mouse T-cell receptor beta gene enhancer blocks alphabeta T-cell development. Proc Natl Acad Sci U S A. 1996;93:7877–7881. - PMC - PubMed
    1. Fowlkes BJ, Schwartz RH, Pardoll DM. Deletion of self-reactive thymocytes occurs at a CD4+8+ precursor stage. Nature. 1988;334:620–623. doi: 10.1038/334620a0. - DOI - PubMed
    1. White H, Bergmann G. Localization in near-monolayer films. Phys Rev B Condens Matter. 1989;40:11594–11602. - PubMed
    1. Wu L, Shortman K. Heterogeneity of thymic dendritic cells. Semin Immunol. 2005;17:304–312. doi: 10.1016/j.smim.2005.05.001. S1044-5323(05)00039-4 [pii] - DOI - PubMed

Publication types

Substances

LinkOut - more resources