. 2014 Sep;82(9):3948-57.
doi: 10.1128/IAI.02191-14. Epub 2014 Jul 7.

Retinoid levels influence enterohemorrhagic Escherichia coli infection and Shiga toxin 2 susceptibility in mice

Affiliations

Retinoid levels influence enterohemorrhagic Escherichia coli infection and Shiga toxin 2 susceptibility in mice

Gabriel Cabrera et al. Infect Immun. 2014 Sep.

Abstract

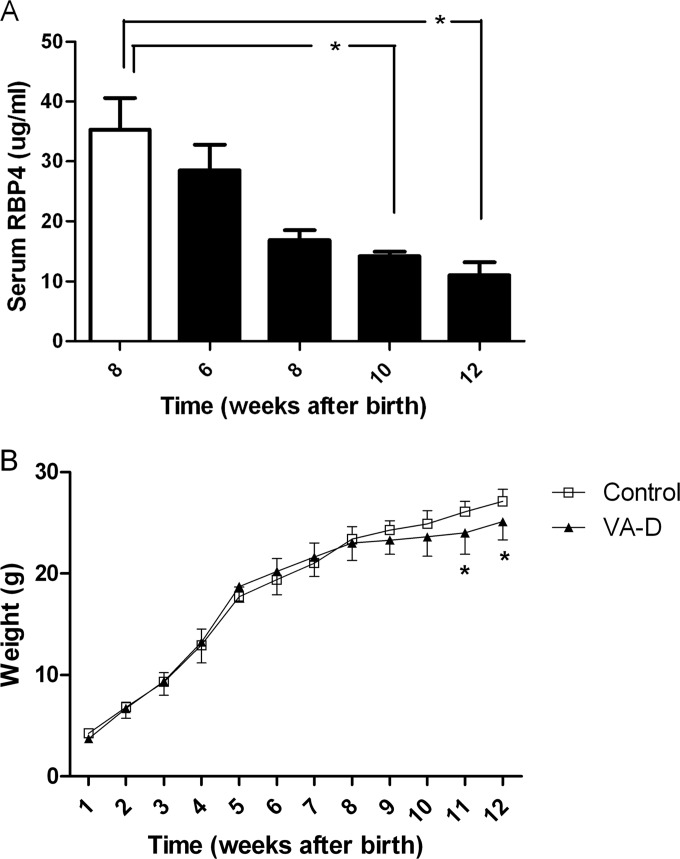
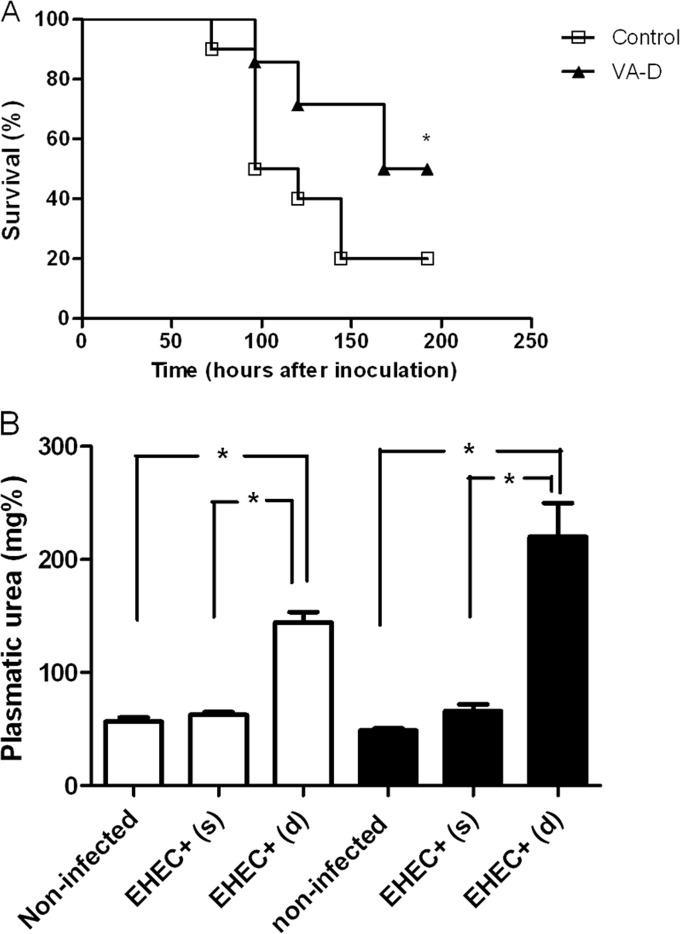
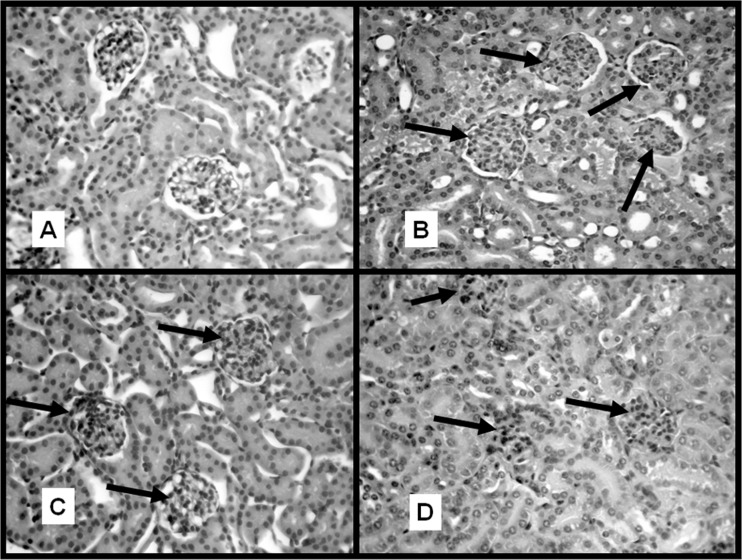
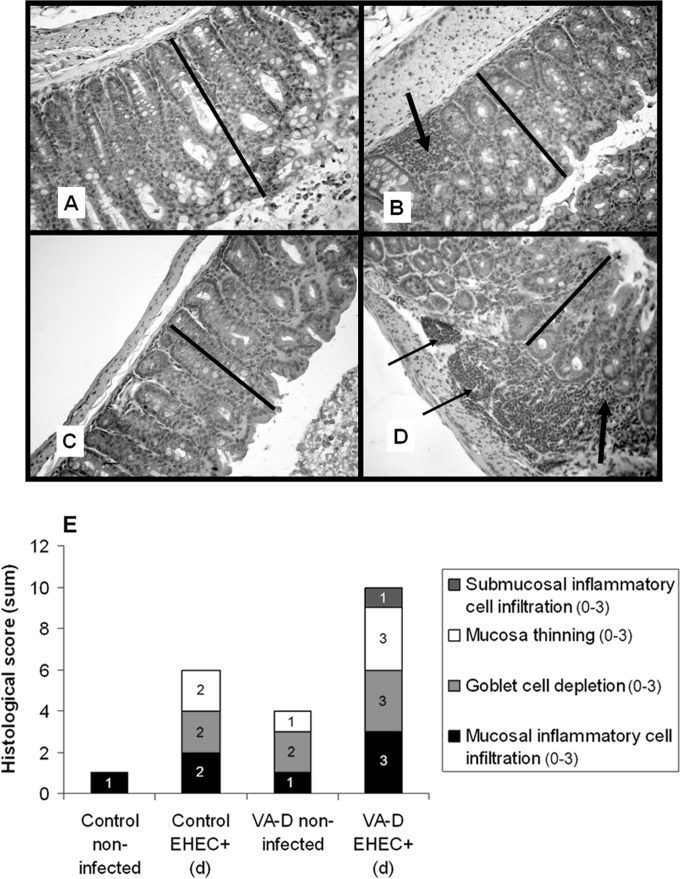
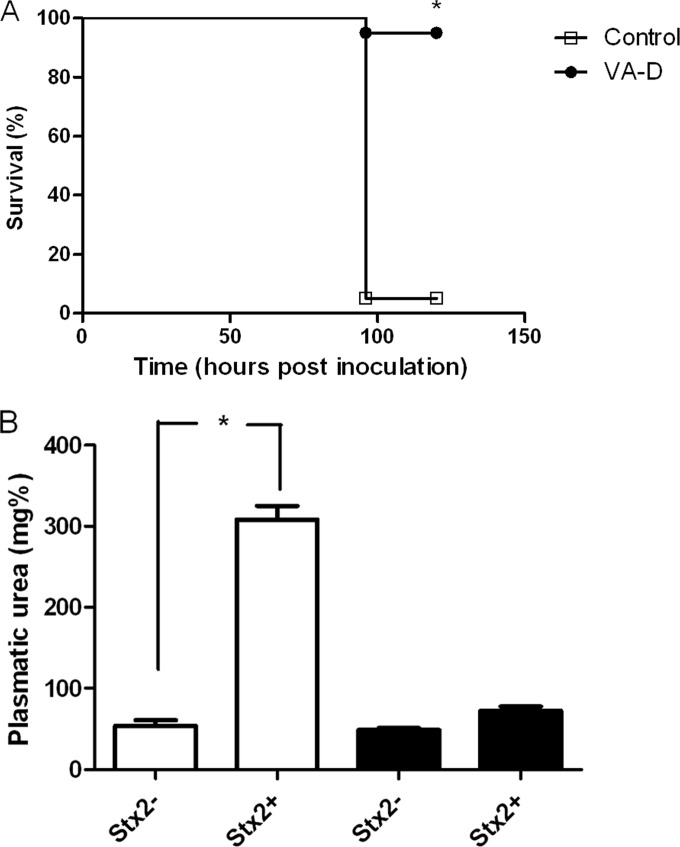
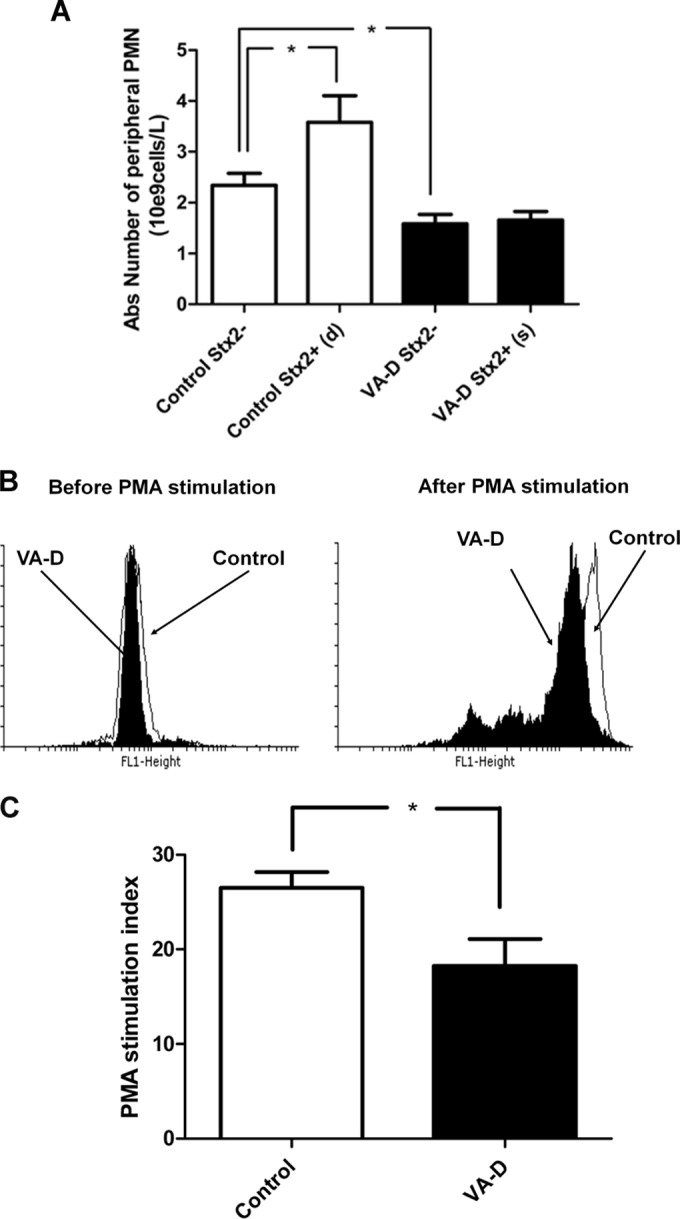
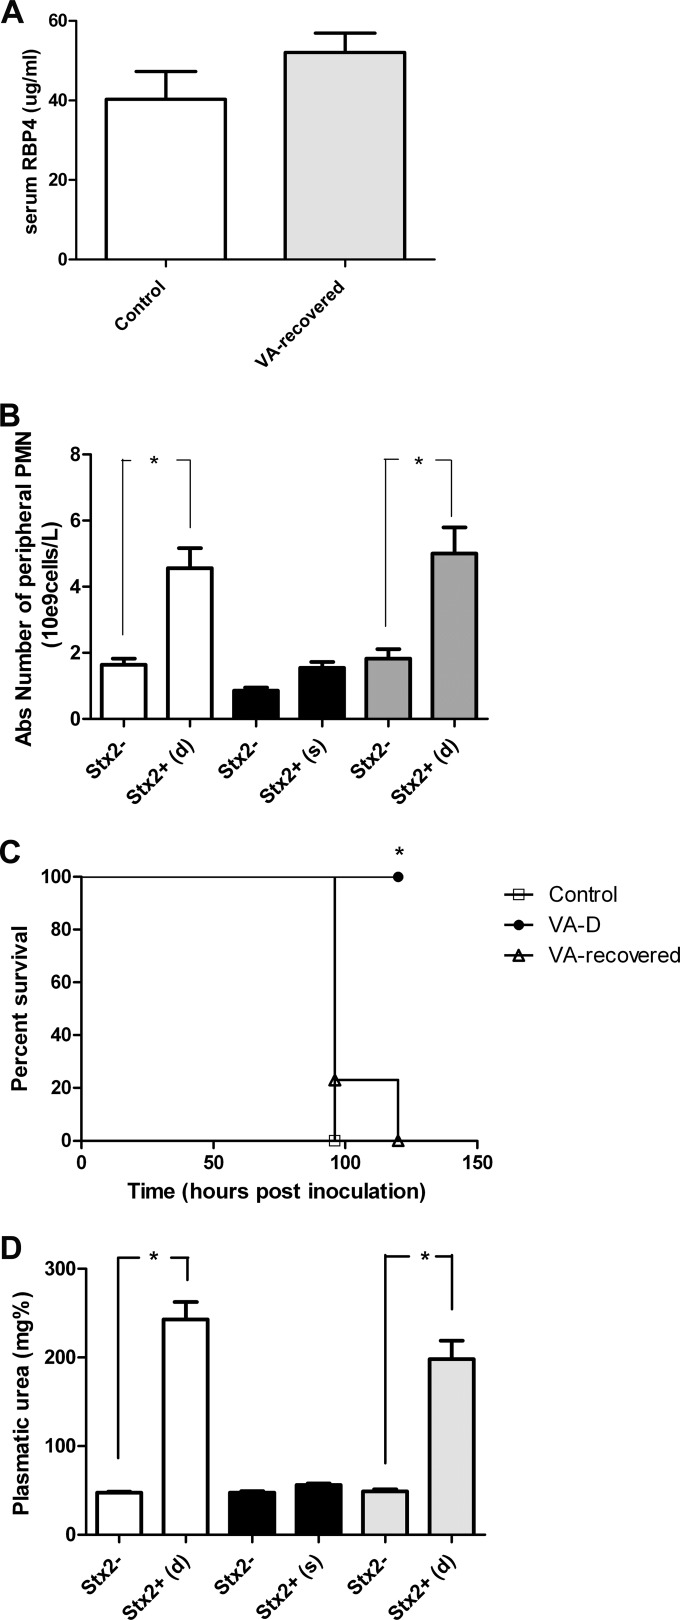
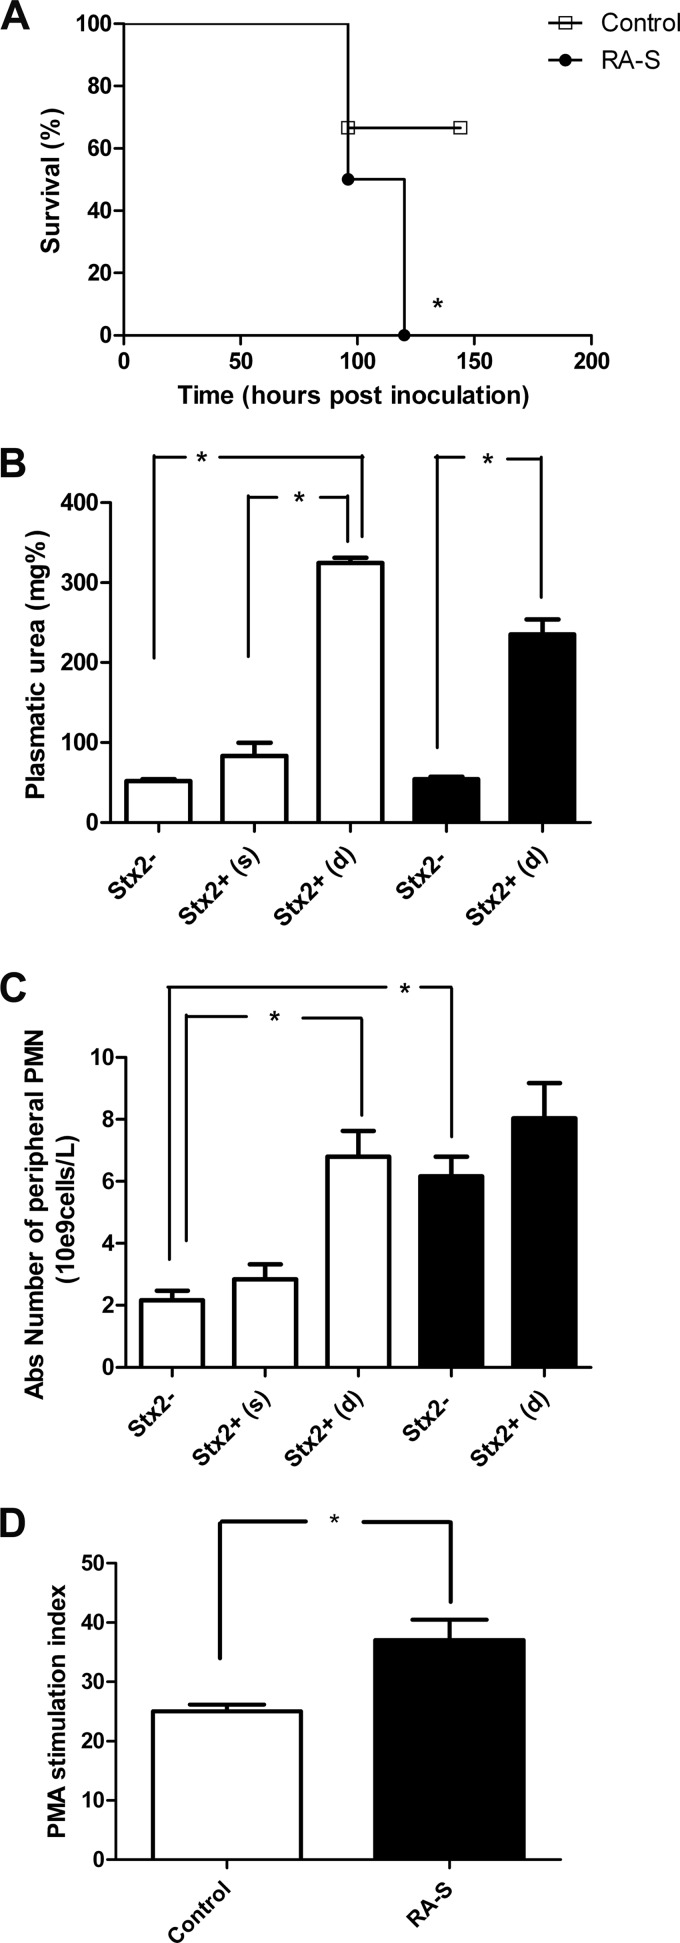
Enterohemorrhagic Escherichia coli (EHEC) is a food-borne pathogen that produces Shiga toxin (Stx) and causes hemorrhagic colitis. Under some circumstances, Stx produced within the intestinal tract enters the bloodstream, leading to systemic complications that may cause the potentially fatal hemolytic-uremic syndrome. Although retinoids like vitamin A (VA) and retinoic acid (RA) are beneficial to gut integrity and the immune system, the effect of VA supplementation on gastrointestinal infections of different etiologies has been controversial. Thus, the aim of this work was to study the influence of different VA status on the outcome of an EHEC intestinal infection in mice. We report that VA deficiency worsened the intestinal damage during EHEC infection but simultaneously improved survival. Since death is associated mainly with Stx toxicity, Stx was intravenously inoculated to analyze whether retinoid levels affect Stx susceptibility. Interestingly, while VA-deficient (VA-D) mice were resistant to a lethal dose of Stx2, RA-supplemented mice were more susceptible to it. Given that peripheral blood polymorphonuclear cells (PMNs) are known to potentiate Stx2 toxicity, we studied the influence of retinoid levels on the absolute number and function of PMNs. We found that VA-D mice had decreased PMN numbers and a diminished capacity to produce reactive oxygen species, while RA supplementation had the opposite effect. These results are in line with the well-known function of retinoids in maintaining the homeostasis of the gut but support the idea that they have a proinflammatory effect by acting, in part, on the PMN population.


Figures

FIG 1
FIG 1
Establishment of the VA-D mouse model. (A) RBP4 concentrations (μg/ml) in the serum of control (white bars) and VA-D mice (black bars) were measured at different times after birth. The values shown are means ± standard errors (three mice per experimental group were used). All data were analyzed by ANOVA and a posteriori Tukey test. *, P < 0.05. The experiment was performed three times with similar results. (B) Body weights of male mice fed a VA-D diet (black triangles) or pair fed a control diet (white squares) were measured weekly after birth. The values shown are the mean body weights of 8 control mice and 10 VA-D mice ± the standard errors. All data were analyzed by a two-tailed Student t test comparing control and VA-D mice of similar ages. *, P < 0.05. The experiment was performed three times with similar results.
FIG 2
FIG 2
Survival and serum urea concentrations after EHEC infection. (A) A dose of 7 × 10¹¹ CFU of EHEC/kg of body weight was orally administered to 11-week-old control (white squares) or VA-D (black triangles) mice. Survival of EHEC-infected mice was monitored daily after bacterial inoculation. Nine control and 14 VA-D mice were used. *, P < 0.05 (log rank test). The experiment was performed three times with similar results using doses in the range of 6 × 10¹¹ to 9 × 10¹¹ CFU of EHEC/kg of body weight. (B) Mice were bled 96 h after oral EHEC inoculation, and urea concentrations in plasma were evaluated. Infected mice were classified retrospectively according to their evaluation as survivors (s) or dead (d). The values shown are mean urea concentrations (mg%) ± the standard errors. Control (white bars) or VA-D (black bars) mice were classified as noninfected, EHEC+ (s), or EHEC+ (d). Numbers of control mice per experimental group: noninfected, 6; EHEC+ (s), 2; EHEC+ (d), 3. Numbers of VA-D mice per experimental group: noninfected, 4; EHEC+ (s), 7; EHEC+ (d), 2. All data were analyzed by ANOVA and a posteriori Tukey test. *, P < 0.05. The experiment was performed three times with similar results.
FIG 3
FIG 3
Histological studies of kidney samples. Kidney samples from control and VA-D mice inoculated with PBS or EHEC were excised at 96 hpi, fixed, and stained with hematoxylin and eosin. Images were acquired with a Carl Zeiss III photomicroscope (Carl Zeiss AG, Oberkochen, Germany). Original magnification, ×250. (A) Kidney tissue of a noninfected control mouse with normal-aspect glomeruli and tubular epithelia preserved. (B) Kidney tissue of an EHEC-infected control mouse showing glomeruli (arrows) with hypercellularity, with some of the glomeruli retracted and the proximal and distal tubular epithelial cytoplasm showing a frosted-glass appearance and frayed luminal edges. (C) Kidney tissue of a noninfected VA-D mouse with normal-aspect glomeruli (arrows) and preserved tubular epithelia. (D) Kidney tissue of an EHEC-infected VA-D mouse showing glomeruli with marked shrinkage (arrow), mesangial hypercellularity, absence of Bowman's space (arrows), proximal and distal tubular epithelia with scant pale cytoplasm, and images of bare nuclei.
FIG 4
FIG 4
Histological studies of colon samples. Colon samples from control and VA-D mice inoculated with PBS or EHEC were excised at 96 hpi, fixed, and stained with hematoxylin and eosin. Images were acquired with a Carl Zeiss III photomicroscope (Carl Zeiss AG, Oberkochen, Germany). Original magnification, ×250. (A) Noninfected control mice show colonic mucosa with normal thickness (bar), preserved architecture, and abundant goblet cells. (B) EHEC-infected control mice show moderately thinned colonic mucosa (bar), a moderately decreased number of goblet cells, and lymphocyte inflammatory infiltrate in the lamina propria (arrow). (C) Noninfected VA-D mice show colonic mucosa with slightly reduced thickness (bar) and a decreased number of goblet cells with a mildly altered glandular architecture. (D) EHEC-infected VA-D mice show colonic mucosa with greatly reduced thickness (bar), architectural alterations, a sharp reduction in the number of goblet cells, and the presence of a chronic inflammatory infiltrate in the lamina propria (thick arrow) and submucosa (thin arrows). (E) Histological scoring of colon samples was performed in a blinded fashion by a pathologist. The y axis shows the sum of the histological scores for the following parameters: mucosal thinning (on a scale 0 to 3), goblet cell depletion (on a scale 0 to 3), mucosal inflammatory-cell infiltration (on a scale 0 to 3), and submucosal inflammatory-cell infiltration (on a scale 0 to 3). Three mice per experimental group were used.
FIG 5
FIG 5
VA deficiency and Stx2 inoculation. (A) The survival of control (white squares) and VA-D (black circles) mice was monitored daily after the i.v. administration of 1 LD100 of Stx2. Ten mice per experimental group were used. *, P < 0.05 (log rank test). The experiment was performed twice with similar results. (B) Control (white bars) and VA-D (black bars) mice were bled 96 h after i.v. inoculation with Stx2, and plasma urea concentrations were evaluated. The values shown are mean urea concentrations (mg%) ± the standard errors. All data were analyzed by ANOVA and a posteriori Tukey test. *, P < 0.05. Five mice per experimental group were used. The experiment was performed twice with similar results.
FIG 6
FIG 6
VA deficiency and PMNs. (A) Control and VA-D mice were bled 96 h after i.v. inoculation with 1 LD100 of Stx2, and the number of PMNs in their blood was determined. Control (white bars) or VA-D (black bars) mice were classified as Stx2 (four per group) or Stx2+ (six per group). Mice were classified retrospectively according to their evaluation as survivors (s) or dead (d). The values shown are mean numbers of PMNs (109 cells/liter) ± the standard errors. All data were analyzed by ANOVA and a posteriori Tukey test. *, P < 0.05. The experiment was performed three times with similar results. Abs, absolute. (B, C) Control and VA-D mice were bled, PMNs were isolated, and ROS production was measured by flow cytometry by using 2 × 10⁵ PMNs per experimental group, as detailed in Materials and Methods. (B) Representative histograms showing MFI before and after PMA stimulation of previously DHR-123-treated PMNs. (C) The PMA stimulation index (MFI after PMA stimulation/MFI before PMA stimulation) of VA-D mice was significantly decreased. *, P < 0.05. Data were analyzed by Student t test. Samples from eight mice were pooled in pairs into four pools per experimental group. The experiment was performed twice with similar results.
FIG 7
FIG 7
Reversibility of VA deficiency. (A) RBP4 concentrations in the serum (μg/ml) of control (white bar) and VA-recovered (gray bar) mice were measured. The values shown are means ± the standard errors (five mice per experimental group were used). No significant differences in RBP4 concentrations were detected. The experiment was performed twice with similar results. (B) Control (white bars), VA-D (black bars), and VA-recovered (gray) mice were bled 96 h after i.v. inoculation with 1 LD100 of Stx2 (six mice per experi- mental group), and the absolute (Abs) number of PMNs in blood was evaluated. Mice were classified retrospectively according to their evaluation as survivors (s) or dead (d). All data were analyzed by ANOVA and a posteriori Tukey test. *, P < 0.05. Four non-Stx2-inoculated mice per control, VA-D, or VA-recovered group were used. The experiment was performed three times with similar results. (C) The survival of control (white squares), VA-D (black circles), and VA-recovered (black triangles) mice was monitored daily after the i.v. administration of 1 LD100 of Stx2 (six mice per experimental group were used). *, P < 0.05 (log rank test comparing VA-D and VA-recovered mice). The experiment was performed twice with similar results. (D) Control (white bars), VA-D (black bars), and VA-recovered (gray bars) mice were bled 96 h after i.v. inoculation with Stx2, and the urea concentrations in their plasma were evaluated. The values shown are mean concentrations (mg%) ± the standard errors. All data were analyzed by ANOVA and a posteriori Tukey test. *, P < 0.05. Six Stx2-inoculated and five non-Stx2-inoculated mice per control, VA-D, or VA-recovered group were used. The experiment was performed twice with similar results.
FIG 8
FIG 8
RA supplementation influences Stx2 toxicity, PMN numbers, and ROS production. (A) The survival of control (white squares) and RA-S (black circles) mice was monitored daily after the i.v. administration of 1 LD30 of Stx2. Twelve mice per experimental group were used. *, P < 0.05 (log rank test). The experiment was performed twice with similar results. (B, C) Control (white bars) and RA-S (black bars) mice were bled 96 h after i.v. inoculation with Stx2. Mice were classified retrospectively according to their evaluation as survivors (s) or dead (d). Numbers of control mice per experimental group: noninfected (Stx2), 4; Stx2+(s), 8; Stx2+(d), 4. Numbers of RA-S mice per experimental group: noninfected (Stx2), 4; Stx2+(d), 12. (B) The values shown are mean urea concentrations (mg%) ± the standard errors. All of the data were analyzed by ANOVA and a posteriori Tukey test. *, P < 0.05. (C) The values shown are mean percentages of PMNs ± the standard errors. All of the data were analyzed by ANOVA and a posteriori Tukey test. *, P < 0.05. The experiment was performed three times with similar results. Abs, absolute. (D) Control and RA-S mice were bled, PMNs were isolated, and ROS production was measured by flow cytometry as detailed in Materials and Methods. The PMA stimulation index (MFI after PMA stimulation/MFI before PMA stimulation) of RA-S mice was significantly increased (*, P < 0.05). Data were analyzed by Student t test; samples from eight mice were combined in pairs into four pools per experimental group. The experiment was performed twice with similar results.

Similar articles

Cited by

References

    1. Riley LW, Remis RS, Helgerson SD, McGee HB, Wells JG, Davis BR, Hebert RJ, Olcott ES, Johnson LM, Hargrett NT, Blake PA, Cohen ML. 1983. Hemorrhagic colitis associated with a rare Escherichia coli serotype. N. Engl. J. Med. 308:681–685. 10.1056/NEJM198303243081203 - DOI - PubMed
    1. Rivas M, Miliwebsky E, Chinen I, Roldan CD, Balbi L, Garcia B, Fiorilli G, Sosa-Estani S, Kincaid J, Rangel J, Griffin PM. 2006. Characterization and epidemiologic subtyping of Shiga toxin-producing Escherichia coli strains isolated from hemolytic uremic syndrome and diarrhea cases in Argentina. Foodborne Pathog. Dis. 3:88–96. 10.1089/fpd.2006.3.88 - DOI - PubMed
    1. Ibarra C, Amaral MM, Palermo MS. 2013. Advances in pathogenesis and therapy of hemolytic uremic syndrome caused by Shiga toxin-2. IUBMB Life 65:827–835. 10.1002/iub.1206 - DOI - PubMed
    1. Kendall MM, Gruber CC, Parker CT, Sperandio V. 2012. Ethanolamine controls expression of genes encoding components involved in interkingdom signaling and virulence in enterohemorrhagic Escherichia coli O157:H7. mBio 3(3):e00050–00012. 10.1128/mBio.00050-12 - DOI - PMC - PubMed
    1. Golan L, Gonen E, Yagel S, Rosenshine I, Shpigel NY. 2011. Enterohemorrhagic Escherichia coli induce attaching and effacing lesions and hemorrhagic colitis in human and bovine intestinal xenograft models. Dis. Model Mech. 4:86–94. 10.1242/dmm.005777 - DOI - PMC - PubMed

Publication types

MeSH terms