

Computational model predictions of cues for concurrent vowel identification
- PMID: 25002128
- PMCID: PMC4164690
- DOI: 10.1007/s10162-014-0475-7
Computational model predictions of cues for concurrent vowel identification
Abstract
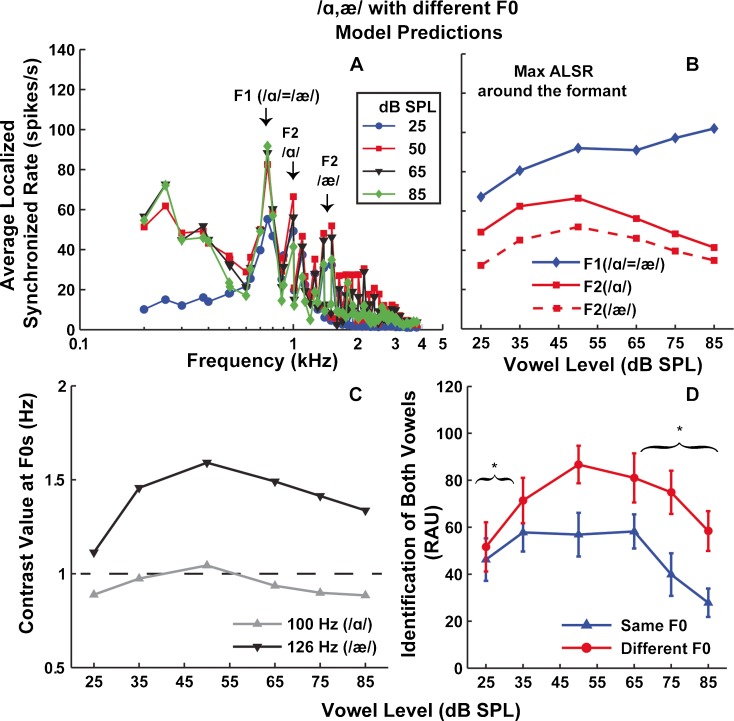
Although differences in fundamental frequencies (F0s) between vowels are beneficial for their segregation and identification, listeners can still segregate and identify simultaneous vowels that have identical F0s, suggesting that additional cues are contributing, including formant frequency differences. The current perception and computational modeling study was designed to assess the contribution of F0 and formant difference cues for concurrent vowel identification. Younger adults with normal hearing listened to concurrent vowels over a wide range of levels (25-85 dB SPL) for conditions in which F0 was the same or different between vowel pairs. Vowel identification scores were poorer at the lowest and highest levels for each F0 condition, and F0 benefit was reduced at the lowest level as compared to higher levels. To understand the neural correlates underlying level-dependent changes in vowel identification, a computational auditory-nerve model was used to estimate formant and F0 difference cues under the same listening conditions. Template contrast and average localized synchronized rate predicted level-dependent changes in the strength of phase locking to F0s and formants of concurrent vowels, respectively. At lower levels, poorer F0 benefit may be attributed to poorer phase locking to both F0s, which resulted from lower firing rates of auditory-nerve fibers. At higher levels, poorer identification scores may relate to poorer phase locking to the second formant, due to synchrony capture by lower formants. These findings suggest that concurrent vowel identification may be partly influenced by level-dependent changes in phase locking of auditory-nerve fibers to F0s and formants of both vowels.
Figures


Similar articles
-
Modeling the level-dependent changes of concurrent vowel scores.J Acoust Soc Am. 2018 Jan;143(1):440. doi: 10.1121/1.5021330. J Acoust Soc Am. 2018. PMID: 29390795 Free PMC article.
-
Effects of age and hearing loss on concurrent vowel identification.J Acoust Soc Am. 2016 Dec;140(6):4142. doi: 10.1121/1.4968781. J Acoust Soc Am. 2016. PMID: 28040038 Free PMC article.
-
The representation of the spectra and fundamental frequencies of steady-state single- and double-vowel sounds in the temporal discharge patterns of guinea pig cochlear-nerve fibers.J Acoust Soc Am. 1990 Sep;88(3):1412-26. doi: 10.1121/1.400329. J Acoust Soc Am. 1990. PMID: 2229676
-
The use of confusion patterns to evaluate the neural basis for concurrent vowel identification.J Acoust Soc Am. 2013 Oct;134(4):2988-3000. doi: 10.1121/1.4820888. J Acoust Soc Am. 2013. PMID: 24116434 Free PMC article.
-
The Influence of Male- and Female-Spoken Vowel Acoustics on Envelope-Following Responses.Semin Hear. 2022 Oct 26;43(3):223-239. doi: 10.1055/s-0042-1756165. eCollection 2022 Aug. Semin Hear. 2022. PMID: 36313043 Free PMC article. Review.
Cited by
-
Effects of Physiological Internal Noise on Model Predictions of Concurrent Vowel Identification for Normal-Hearing Listeners.PLoS One. 2016 Feb 11;11(2):e0149128. doi: 10.1371/journal.pone.0149128. eCollection 2016. PLoS One. 2016. PMID: 26866811 Free PMC article.
-
Jagged-2 enhances immunomodulatory activity in adipose derived mesenchymal stem cells.Sci Rep. 2015 Sep 28;5:14284. doi: 10.1038/srep14284. Sci Rep. 2015. PMID: 26412454 Free PMC article.
-
Contribution of Temporal Fine Structure Cues to Concurrent Vowel Identification and Perception of Zebra Speech.Int Arch Otorhinolaryngol. 2024 Jul 5;28(3):e492-e501. doi: 10.1055/s-0044-1785456. eCollection 2024 Jul. Int Arch Otorhinolaryngol. 2024. PMID: 38974629 Free PMC article.
-
Modeling the level-dependent changes of concurrent vowel scores.J Acoust Soc Am. 2018 Jan;143(1):440. doi: 10.1121/1.5021330. J Acoust Soc Am. 2018. PMID: 29390795 Free PMC article.
-
Brainstem correlates of concurrent speech identification in adverse listening conditions.Brain Res. 2019 Jul 1;1714:182-192. doi: 10.1016/j.brainres.2019.02.025. Epub 2019 Feb 20. Brain Res. 2019. PMID: 30796895 Free PMC article.
References
Publication types
MeSH terms
Grants and funding
LinkOut - more resources
Full Text Sources
Other Literature Sources
Miscellaneous
