. 2014 Jul 17;55(2):332-41.
doi: 10.1016/j.molcel.2014.06.003. Epub 2014 Jul 4.

Proteomic mapping of the human mitochondrial intermembrane space in live cells via ratiometric APEX tagging

Affiliations

Proteomic mapping of the human mitochondrial intermembrane space in live cells via ratiometric APEX tagging

Victoria Hung et al. Mol Cell. .

Abstract

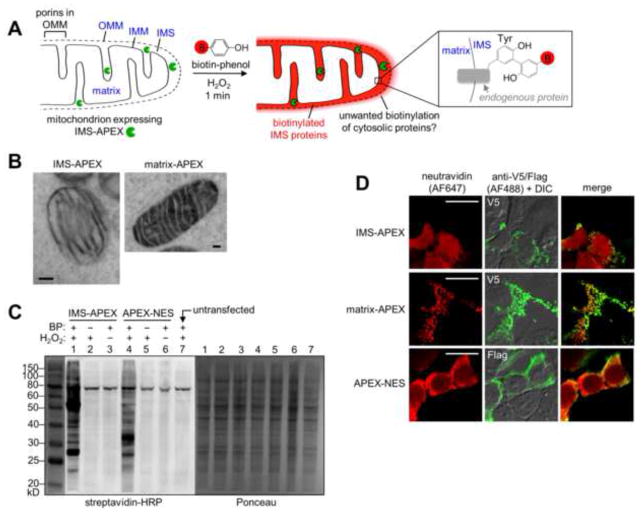
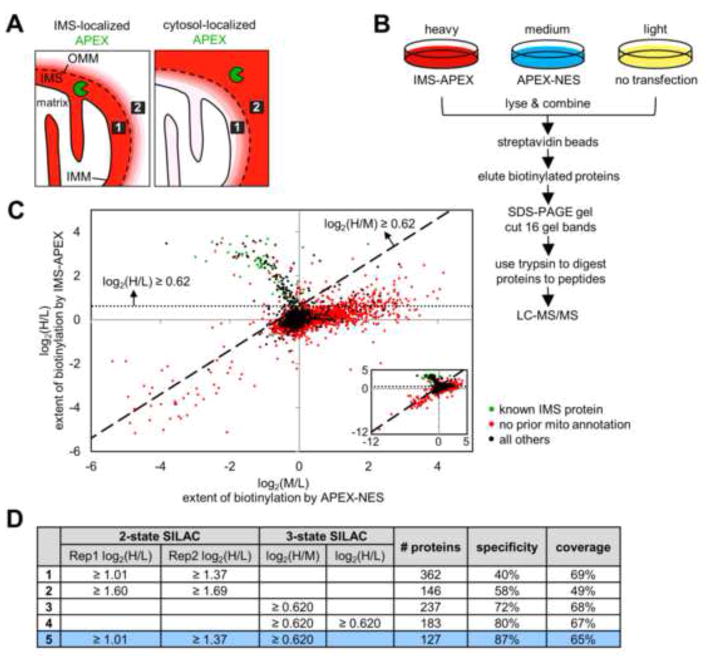
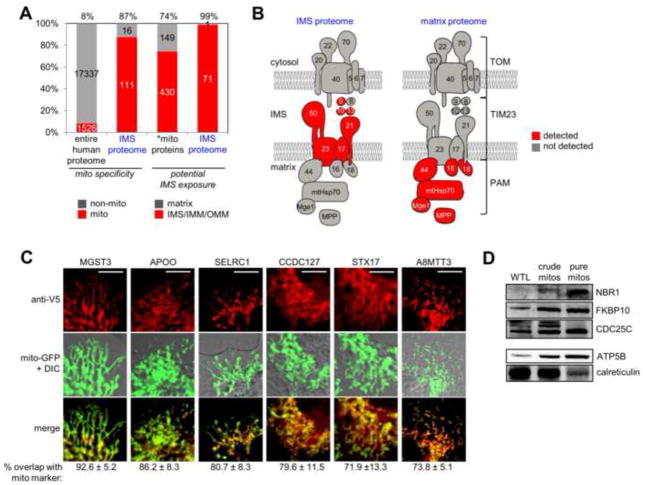
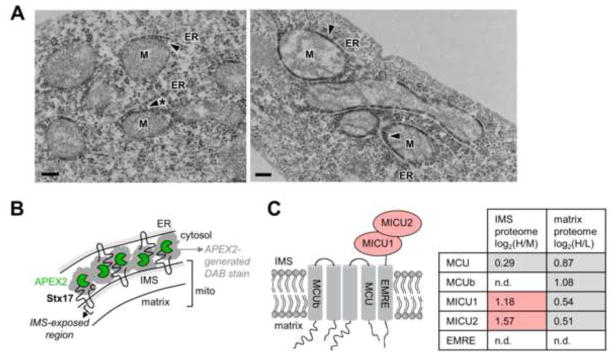
Obtaining complete protein inventories for subcellular regions is a challenge that often limits our understanding of cellular function, especially for regions that are impossible to purify and are therefore inaccessible to traditional proteomic analysis. We recently developed a method to map proteomes in living cells with an engineered peroxidase (APEX) that bypasses the need for organellar purification when applied to membrane-bound compartments; however, it was insufficiently specific when applied to unbounded regions that allow APEX-generated radicals to escape. Here, we combine APEX technology with a SILAC-based ratiometric tagging strategy to substantially reduce unwanted background and achieve nanometer spatial resolution. This is applied to map the proteome of the mitochondrial intermembrane space (IMS), which can freely exchange small molecules with the cytosol. Our IMS proteome of 127 proteins has >94% specificity and includes nine newly discovered mitochondrial proteins. This approach will enable scientists to map proteomes of cellular regions that were previously inaccessible.


Figures

Figure 1
Figure 1
APEX-based proteomic mapping scheme and characterization of IMS-APEX labeling. (A) Scheme. APEX (green pacman) is targeted to the intermembrane space (IMS) of HEK 293T cells by genetic fusion to the leader sequence of the IMS protein LACTB (Polianskyte et al., 2009). The IMS and matrix subcompartments of the mitochondrion are labeled in blue, in addition to the outer mitochondrial membrane (OMM) and inner mitochondrial membrane (IMM). To initiate proteomic tagging, H2O2 is added to live cells for 1 minute in the presence of biotin-phenol (red B = biotin). APEX catalyzes the generation of biotin-phenoxyl radicals, which tag proximal endogenous proteins. Cells are then lysed, and tagged proteins are enriched with streptavidin beads and identified by mass spectrometry. Due to the porosity of the OMM (porins allow passage of molecules <5 kD (Herrmann and Riemer, 2010)), IMS-APEX can tag some cytosolic proteins outside mitochondria, giving unwanted background. This study reports a new ratiometric method to eliminate this background. The enlarged box at right shows one possible structure of the biotin-phenol adduct with a tyrosine side chain. Other adduct structures, including with other amino acids, are likely to be formed as well. (B) EM characterization of IMS-APEX localization. HEK 293T cells expressing IMS-APEX were fixed and then overlaid with a solution of diaminobenzidine (DAB) and H2O2. APEX catalyzes the oxidation of DAB to generate a locally-deposited DAB polymer (Martell et al., 2012). After staining the polymer with electron-dense OsO4, the sample was imaged by EM. For comparison, APEX targeted to the mitochondrial matrix (Rhee et al., 2013) is shown on the right. Scale bars, 100 nm. (C) Streptavidin blot analysis of endogenous proteins tagged by IMS-APEX. Samples were transfected with IMS-APEX or cytosolic APEX-NES (NES = nuclear export sequence) and labeled for 1 minute as in (A). Afterwards, cells were lysed, run on gel, and analyzed by streptavidin blotting (left) and Ponceau staining (right). Negative controls are shown with biotin phenol (BP) omitted (lanes 2 and 5) or H2O2 omitted (lanes 3 and 6). Lane 7 shows untransfected cells. The band near 80 kD contains the endogenously biotinylated proteins 3-methylcrotonyl-CoA carboxylase and propionyl-CoA carboxylase (Chandler and Ballard, 1986). (D) Fluorescence imaging of IMS-APEX labeling in cells. HEK 293T cells were transfected with IMS-APEX, matrix-APEX, or APEX-NES and labeled live as in (A). Cells were then fixed and stained with neutravidin to visualize biotinylated proteins, and anti-V5 or anti-Flag antibody to visualize APEX localization. The anti-V5/Flag channel is not normalized. Scale bars, 20 μm.
Figure 2
Figure 2
Ratiometric APEX tagging strategy improves spatial specificity and produces a high quality IMS proteome. (A) Because the OMM is permeable to molecules <5 kDa, including the biotin-phenoxyl radical, some cytosolic proteins will be tagged by IMS-APEX. However, it is possible to distinguish IMS proteins (e.g., protein 1, represented by the black box) from cytosolic proteins (e.g., protein 2) by comparing each protein’s extent of biotinylation by IMS-APEX (left) versus cytosolic APEX (APEX-NES) (right). For example, protein 1 should be more strongly biotinylated by IMS-APEX than by APEX-NES, regardless of its steric accessibility or surface tyrosine count. Conversely, protein 2 should be tagged more extensively by APEX-NES than by IMS-APEX. Red coloring represents endogenous proteins biotinylated by APEX. (B) 3-State SILAC experimental setup. Three HEK 293T cultures were treated identically with biotin-phenol and H2O2 for 1 minute, but the heavy culture expressed IMS-APEX, the medium culture expressed APEX-NES, and the light culture was untransfected. After labeling, the three lysate samples were combined and processed together as shown. For each protein, the H/L SILAC ratio reflects the extent of its biotinylation by IMS-APEX. The M/L SILAC ratio reflects the extent of its biotinylation by APEX-NES. The H/M SILAC ratio reflects the ratio of that protein’s biotinylation by IMS-APEX versus APEX-NES. (C) Scatter plot showing H/L ratio plotted against M/L ratio for 99.96% of the 4,868 proteins identified by MS (inset shows all proteins, including the few with very low SILAC ratios). Proteins previously known to be IMS-exposed are colored green in the plot (i.e., true positives, defined as members of our “IMS gold+ list” (tab 1 of Table S2)). Proteins without previous mitochondrial annotation are colored red (false positives). SILAC cut-offs used in row 4 of (D) are shown by the dashed lines. See “Scatter plot analysis” in the Supplemental Experimental Procedures and tab 5 of Table S1 for details. (D) Table showing IMS proteome size, specificity, and coverage derived from different datasets and different SILAC cut-offs (truncated to three significant figures). Specificity refers to mitochondrial specificity, i.e. the percentage of the proteome that has mitochondrial annotation in GOCC (Ashburner et al., 2000), Mitocarta (Pagliarini et al., 2008), our previous mitochondrial matrix proteome (Rhee et al., 2013), or the literature. Coverage refers to the percentage of our IMS gold+ list (tab 1 of Table S2) that is detected in the proteome. Condition 5 (bottom row, colored blue) was used to obtain the final IMS proteome (shown in tab 1 of Table S1). Rep1 and Rep2 are the two different replicates of the 2-state SILAC experiment described in Figure S2A.
Figure 3
Figure 3
Characterization of IMS proteome specificity. (A) Bar graph showing the enrichment of mitochondrial proteins as well as IMS proteins in the IMS proteome. The first two columns show the percentage of proteins, in the entire human proteome and in the IMS proteome, respectively, with prior mitochondrial annotation. The second two columns show the percentage of proteins with potential IMS exposure (IMS, IMM, or OMM annotation). *mito proteins refers to the 579 mitochondrial proteins with annotated sub-mitochondrial localization. See tab 4 of Table S2 for details. (B) Subunits of the TOM/TIM/PAM mitochondrial protein import complex (Gebert et al., 2011) detected in the IMS proteome (left) and in our previous mitochondrial matrix proteome (right) (Rhee et al., 2013). See tab 5 of Table S2 for details. (C) Imaging analysis of six mitochondrial orphans identified in this study. After transient transfection, proteins were detected by anti-V5 staining in COS-7 cells, and compared to a mitochondrial GFP marker. Regions of overlap are colored yellow in the “merge” row. Quantitation of overlap from ≥10 cells for each protein is given beneath each image set. A positive control construct (IMS-APEX) gave 89.3% ± 6.3% mitochondrial overlap, while negative control constructs (P4HB-V5 and APEX-NES) gave 40.3% ± 9.9% and 27.0% ± 9.0% mitochondrial overlap, respectively (data not shown). Scale bars, 10 μm. Note that imaging experiments for individual orphans were performed separately, rather than in parallel, but are shown together here. (D) Western blot detection of three mitochondrial orphans identified in this study, in purified mouse liver mitochondria. WTL is whole tissue lysate. Protein molecular weights are 110 kD (NBR1), 65 kD (FKBP10), and 50 kD (CDC25C). Control blots are shown for a mitochondrial matrix marker (ATP5B, 51 kD), which becomes enriched as mitochondrial purity increases, and an ER marker (calreticulin, 48 kD), which becomes de-enriched.
Figure 4
Figure 4
Localization analysis of Stx17 and MICU1. (A) EM imaging of syntaxin 17 (Stx17) with an APEX2 tag (Lam et al., submitted) fused to its N-terminus. HEK 293T were transduced with APEX2-Stx17 lentivirus, then processed as in Figure 1B. DAB staining (arrowheads) is observed at junctions between mitochondria (M) and endoplasmic reticulum (ER) tubules. Scale bars, 200 nm. (B) Cartoon illustrating possible arrangement of Stx17 molecules at starred mitochondria-ER contact site in (A). Stx17 is a SNARE-type protein with two transmembrane domains and N- and C-termini that face the cytosol (Itakura et al., 2012). Based on the DAB staining pattern in (A), we propose that Stx17 resides in both OMM and ER membranes with its N-terminus facing the cytosol. For the OMM pool, the hairpin loop joining the two transmembrane domains would contact the IMS, explaining the detection of Stx17 in our IMS proteome. (C) Known components of the mitochondrial calcium uniporter (MCU) complex are depicted at left (Sancak et al., 2013). In the table at right, for each protein of this complex, the corresponding IMS proteome (3-state experiment) and matrix proteome (replicate 1) SILAC values are listed. n.d. indicates not detected. Grey-shaded values were below the cut-offs for inclusion in IMS or matrix proteomes. Red-shaded values were above the cut-offs for inclusion in the IMS proteome. See tab 7 of Table S2 for details.

References

    1. del Arco A, Satrústegui J. Identification of a Novel Human Subfamily of Mitochondrial Carriers with Calcium-binding Domains. J Biol Chem. 2004;279:24701–24713. - PubMed
    1. Ashburner M, Ball CA, Blake JA, Botstein D, Butler H, Cherry JM, Davis AP, Dolinski K, Dwight SS, Eppig JT, et al. Gene Ontology: tool for the unification of biology. Nat Genet. 2000;25:25–29. - PMC - PubMed
    1. Beck M, Schmidt A, Malmstroem J, Claassen M, Ori A, Szymborska A, Herzog F, Rinner O, Ellenberg J, Aebersold R. The quantitative proteome of a human cell line. Mol Syst Biol. 2011;7:549. - PMC - PubMed
    1. Bolender N, Sickmann A, Wagner R, Meisinger C, Pfanner N. Multiple pathways for sorting mitochondrial precursor proteins. EMBO Rep. 2008;9:42–49. - PMC - PubMed
    1. Bonora M, Patergnani S, Rimessi A, De Marchi E, Suski JM, Bononi A, Giorgi C, Marchi S, Missiroli S, Poletti F, et al. ATP synthesis and storage. Purinergic Signal. 2012;8:343–357. - PMC - PubMed

Publication types