

eXamine: exploring annotated modules in networks
- PMID: 25002203
- PMCID: PMC4084410
- DOI: 10.1186/1471-2105-15-201
eXamine: exploring annotated modules in networks
Abstract
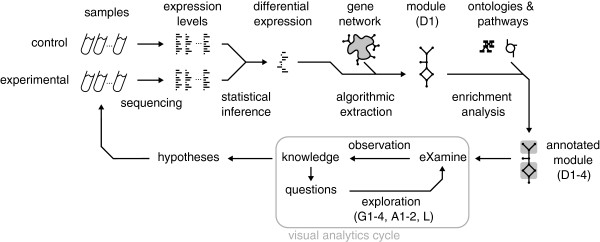
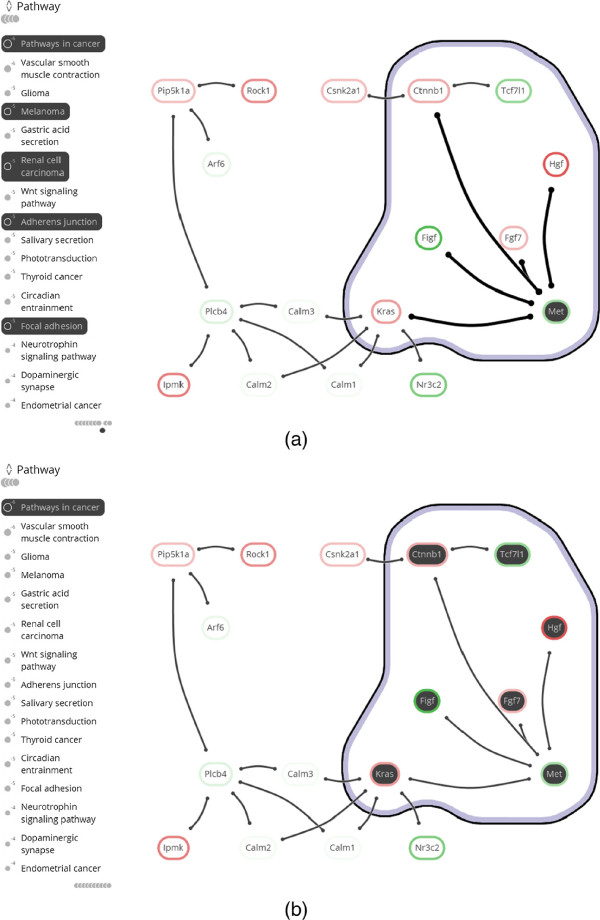
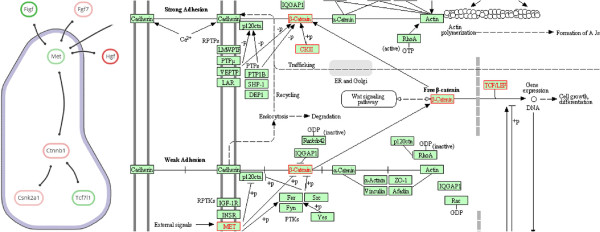
Background: Biological networks have a growing importance for the interpretation of high-throughput "omics" data. Integrative network analysis makes use of statistical and combinatorial methods to extract smaller subnetwork modules, and performs enrichment analysis to annotate the modules with ontology terms or other available knowledge. This process results in an annotated module, which retains the original network structure and includes enrichment information as a set system. A major bottleneck is a lack of tools that allow exploring both network structure of extracted modules and its annotations.
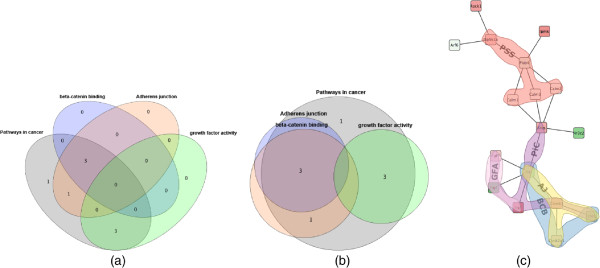
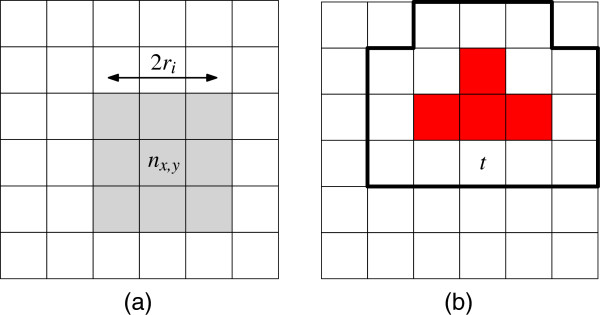
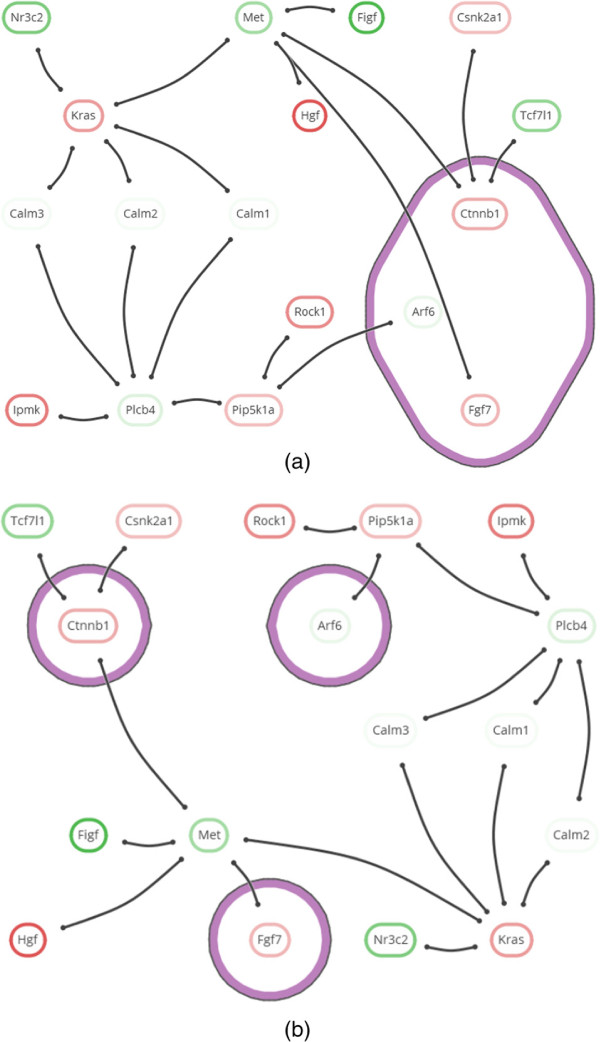
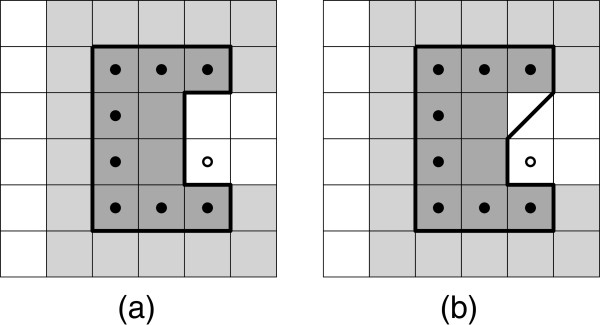
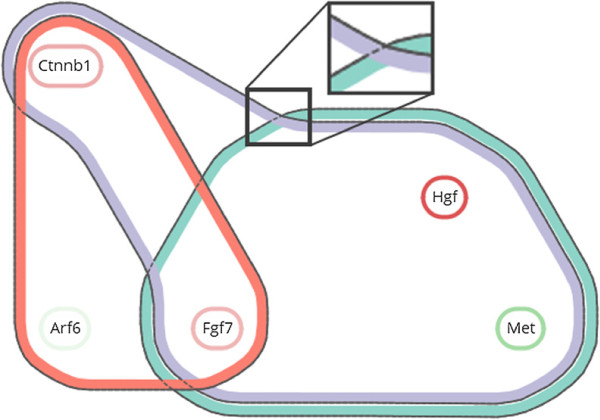
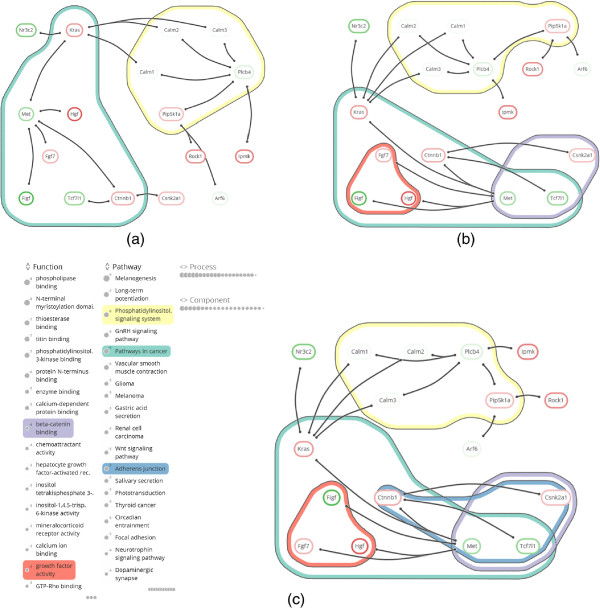
Results: This paper presents a visual analysis approach that targets small modules with many set-based annotations, and which displays the annotations as contours on top of a node-link diagram. We introduce an extension of self-organizing maps to lay out nodes, links, and contours in a unified way. An implementation of this approach is freely available as the Cytoscape app eXamine
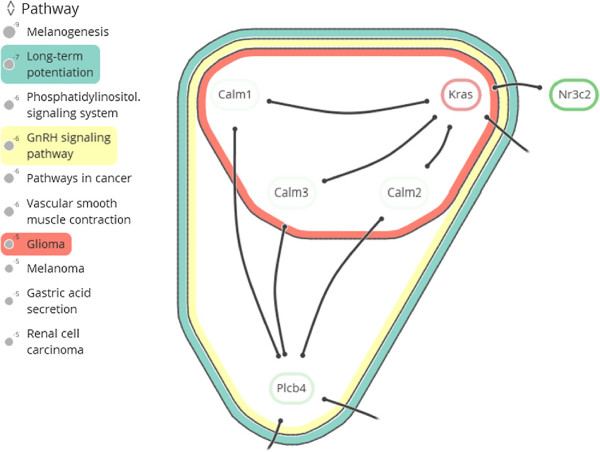
Conclusions: eXamine accurately conveys small and annotated modules consisting of several dozens of proteins and annotations. We demonstrate that eXamine facilitates the interpretation of integrative network analysis results in a guided case study. This study has resulted in a novel biological insight regarding the virally-encoded G-protein coupled receptor US28.
Figures
Similar articles
-
eXamine: Visualizing annotated networks in Cytoscape.F1000Res. 2018 Apr 30;7:519. doi: 10.12688/f1000research.14612.2. eCollection 2018. F1000Res. 2018. PMID: 29983924 Free PMC article.
-
NET-GE: a novel NETwork-based Gene Enrichment for detecting biological processes associated to Mendelian diseases.BMC Genomics. 2015;16 Suppl 8(Suppl 8):S6. doi: 10.1186/1471-2164-16-S8-S6. Epub 2015 Jun 18. BMC Genomics. 2015. PMID: 26110971 Free PMC article.
-
AutoAnnotate: A Cytoscape app for summarizing networks with semantic annotations.F1000Res. 2016 Jul 15;5:1717. doi: 10.12688/f1000research.9090.1. eCollection 2016. F1000Res. 2016. PMID: 27830058 Free PMC article.
-
CytoCluster: A Cytoscape Plugin for Cluster Analysis and Visualization of Biological Networks.Int J Mol Sci. 2017 Aug 31;18(9):1880. doi: 10.3390/ijms18091880. Int J Mol Sci. 2017. PMID: 28858211 Free PMC article.
-
NCMine: Core-peripheral based functional module detection using near-clique mining.Bioinformatics. 2016 Nov 15;32(22):3454-3460. doi: 10.1093/bioinformatics/btw488. Epub 2016 Jul 27. Bioinformatics. 2016. PMID: 27466623 Free PMC article.
Cited by
-
An NMF-L2,1-Norm Constraint Method for Characteristic Gene Selection.PLoS One. 2016 Jul 18;11(7):e0158494. doi: 10.1371/journal.pone.0158494. eCollection 2016. PLoS One. 2016. PMID: 27428058 Free PMC article.
-
Integrating Candida albicans metabolism with biofilm heterogeneity by transcriptome mapping.Sci Rep. 2016 Oct 21;6:35436. doi: 10.1038/srep35436. Sci Rep. 2016. PMID: 27765942 Free PMC article.
-
Clustering approaches for visual knowledge exploration in molecular interaction networks.BMC Bioinformatics. 2018 Aug 29;19(1):308. doi: 10.1186/s12859-018-2314-z. BMC Bioinformatics. 2018. PMID: 30157777 Free PMC article.
-
Excessive Neutrophils and Neutrophil Extracellular Traps in COVID-19.Front Immunol. 2020 Aug 18;11:2063. doi: 10.3389/fimmu.2020.02063. eCollection 2020. Front Immunol. 2020. PMID: 33013872 Free PMC article.
-
Visual analysis of biological data-knowledge networks.BMC Bioinformatics. 2015 Apr 29;16:135. doi: 10.1186/s12859-015-0550-z. BMC Bioinformatics. 2015. PMID: 25925016 Free PMC article.
References
-
- Alizadeh AA, Eisen MB, Davis RE, Ma C, Lossos IS, Rosenwald A, Boldrick JC, Sabet H, Tran T, Yu X, Powell JI, Yang L, Marti GE, Moore T, Hudson J, Lu L, Lewis DB, Tibshirani R, Sherlock G, Chan WC, Greiner TC, Weisenburger DD, Armitage JO, Warnke R, Levy R, Wilson W, Grever MR, Byrd JC, Botstein D, Brown PO, Staudt LM. Distinct types of diffuse large B-cell lymphoma identified by gene expression profiling. Nature. 2000;403(6769):503–511. doi: 10.1038/35000501. - DOI - PubMed
-
- van de Vijver MJ, He YD, van’t Veer LJ, Dai H, Hart AAM, Voskuil DW, Schreiber GJ, Peterse JL, Roberts C, Marton MJ, Parrish M, Atsma D, Witteveen A, Glas A, Delahaye L, van der Velde T, Bartelink H, Rodenhuis S, Rutgers ET, Friend SH, Bernards R. A gene-expression signature as a predictor of survival in breast cancer. N Engl J Med. 2002;347(25):1999–2009. doi: 10.1056/NEJMoa021967. - DOI - PubMed
Publication types
MeSH terms
Substances
LinkOut - more resources
Full Text Sources
Other Literature Sources
