

Local versus global scales of organization in auditory cortex
- PMID: 25002236
- PMCID: PMC4152386
- DOI: 10.1016/j.tins.2014.06.003
Local versus global scales of organization in auditory cortex
Abstract
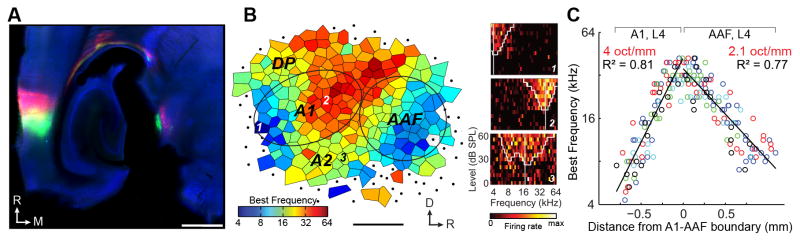
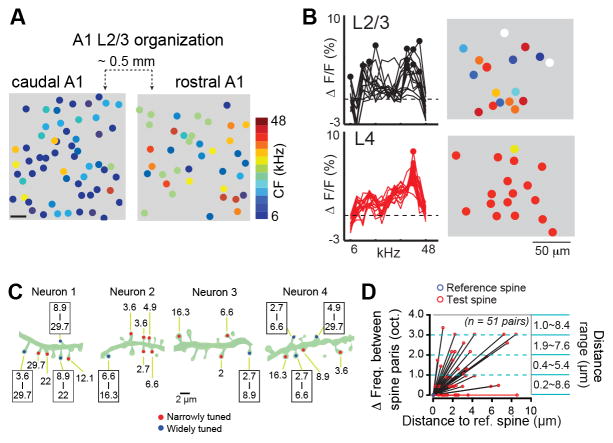
Topographic organization is a hallmark of sensory cortical organization. Topography is robust at spatial scales ranging from hundreds of microns to centimeters, but can dissolve at the level of neighboring neurons or subcellular compartments within a neuron. This dichotomous spatial organization is especially pronounced in the mouse auditory cortex, where an orderly tonotopic map can arise from heterogeneous frequency tuning between local neurons. Here, we address a debate surrounding the robustness of tonotopic organization in the auditory cortex that has persisted in some form for over 40 years. Drawing from various cortical areas, cortical layers, recording methodologies, and species, we describe how auditory cortical circuitry can simultaneously support a globally systematic, yet locally heterogeneous representation of this fundamental sound property.
Keywords: auditory cortex; calcium; electrophysiology; frequency; heterogeneity; homogeneity; imaging; layers; maps; resolution; scale.
Copyright © 2014 Elsevier Ltd. All rights reserved.
Figures
Similar articles
-
Spatial pattern of intra-laminar connectivity in supragranular mouse auditory cortex.Front Neural Circuits. 2014 Mar 11;8:15. doi: 10.3389/fncir.2014.00015. eCollection 2014. Front Neural Circuits. 2014. PMID: 24653677 Free PMC article.
-
Complexity of frequency receptive fields predicts tonotopic variability across species.Elife. 2020 May 18;9:e53462. doi: 10.7554/eLife.53462. Elife. 2020. PMID: 32420865 Free PMC article.
-
Robustness of cortical topography across fields, laminae, anesthetic states, and neurophysiological signal types.J Neurosci. 2012 Jul 4;32(27):9159-72. doi: 10.1523/JNEUROSCI.0065-12.2012. J Neurosci. 2012. PMID: 22764225 Free PMC article.
-
Modular organization of frequency integration in primary auditory cortex.Annu Rev Neurosci. 2000;23:501-29. doi: 10.1146/annurev.neuro.23.1.501. Annu Rev Neurosci. 2000. PMID: 10845073 Review.
-
Processing of complex sounds in the auditory cortex of cat, monkey, and man.Acta Otolaryngol Suppl. 1997;532:34-8. doi: 10.3109/00016489709126142. Acta Otolaryngol Suppl. 1997. PMID: 9442842 Review.
Cited by
-
Local homogeneity of tonotopic organization in the primary auditory cortex of marmosets.Proc Natl Acad Sci U S A. 2019 Feb 19;116(8):3239-3244. doi: 10.1073/pnas.1816653116. Epub 2019 Feb 4. Proc Natl Acad Sci U S A. 2019. PMID: 30718428 Free PMC article.
-
Neuronal Avalanches in Input and Associative Layers of Auditory Cortex.Front Syst Neurosci. 2019 Sep 4;13:45. doi: 10.3389/fnsys.2019.00045. eCollection 2019. Front Syst Neurosci. 2019. PMID: 31551721 Free PMC article.
-
Harmony in the Molecular Orchestra of Hearing: Developmental Mechanisms from the Ear to the Brain.Annu Rev Neurosci. 2024 Aug;47(1):1-20. doi: 10.1146/annurev-neuro-081423-093942. Epub 2024 Jul 1. Annu Rev Neurosci. 2024. PMID: 38360566 Free PMC article. Review.
-
Context-dependent signaling of coincident auditory and visual events in primary visual cortex.Elife. 2019 May 23;8:e44006. doi: 10.7554/eLife.44006. Elife. 2019. PMID: 31115334 Free PMC article.
-
Distinct topographic organization and network activity patterns of corticocollicular neurons within layer 5 auditory cortex.Front Neural Circuits. 2023 Jul 13;17:1210057. doi: 10.3389/fncir.2023.1210057. eCollection 2023. Front Neural Circuits. 2023. PMID: 37521334 Free PMC article.
References
-
- Larionow W. Ueber die musikalischen Centren des Geirns. Pflugers Archiv European Journal of Physiology. 1899;76:608–625.
-
- Munk H. #x000DC;ber die Funktionen der Grosshirnrinde. Hirschwald; 1881.
-
- Woolsey CN, Walzl EM. Topical projection of nerve fibers from local regions of the cochlea to the cerebral cortex of the cat. Bull Johns Hopkins Hosp. 1942;71:315–344.
-
- Erulkar SD, Rose JE, Davies PW. Single unit activity in the auditory cortex of the cat. Bull Johns Hopkins Hosp. 1956;99:55–86. - PubMed
-
- Andersen RA, Snyder RL, Merzenich MM. The topographic organization of corticocollicular projections from physiologically identified loci in the AI, AII, and anterior auditory cortical fields of the cat. J Comp Neurol. 1980;191:479–494. - PubMed
Publication types
MeSH terms
Grants and funding
LinkOut - more resources
Full Text Sources
Other Literature Sources
