. 2014 Sep;86(3):318-29.
doi: 10.1124/mol.114.093757. Epub 2014 Jul 7.

Insights into the gating mechanism of the ryanodine-modified human cardiac Ca2+-release channel (ryanodine receptor 2)

Affiliations

Insights into the gating mechanism of the ryanodine-modified human cardiac Ca2+-release channel (ryanodine receptor 2)

Saptarshi Mukherjee et al. Mol Pharmacol. 2014 Sep.

Abstract

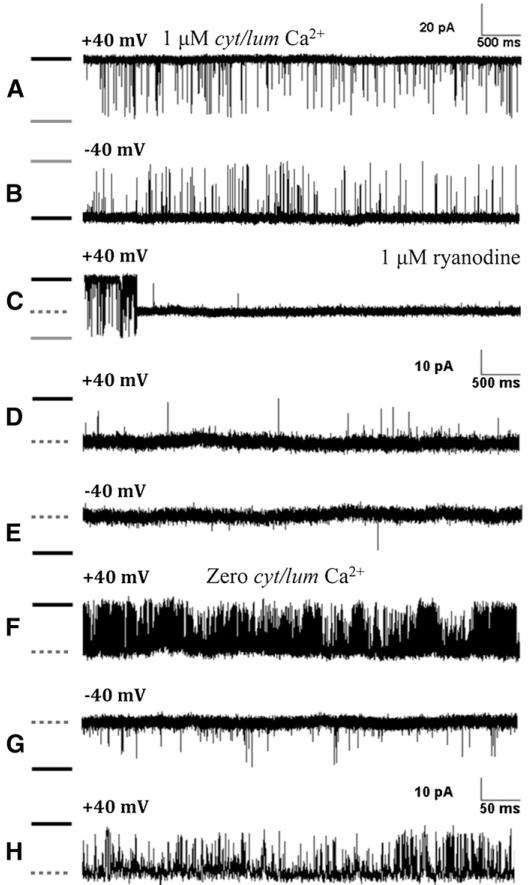
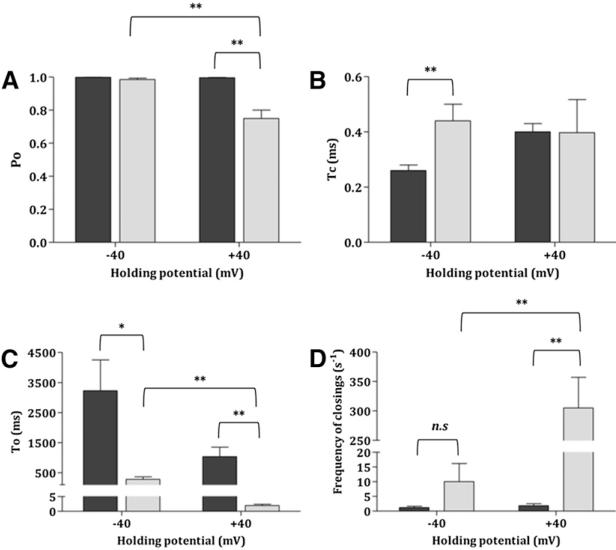
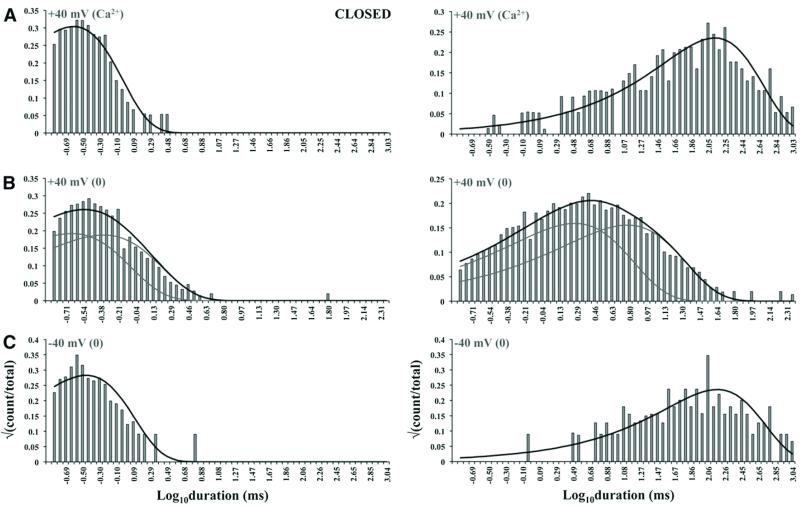
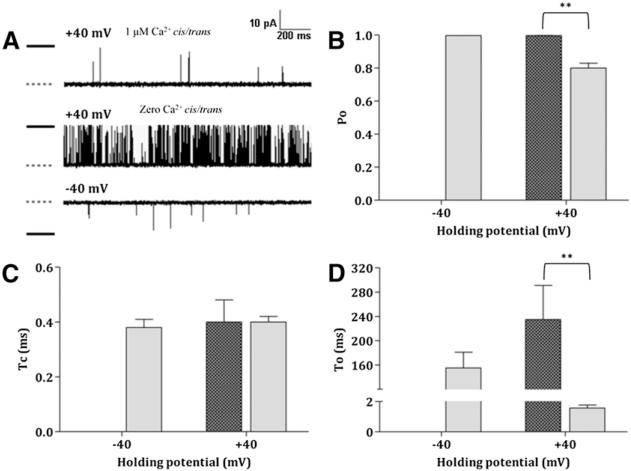
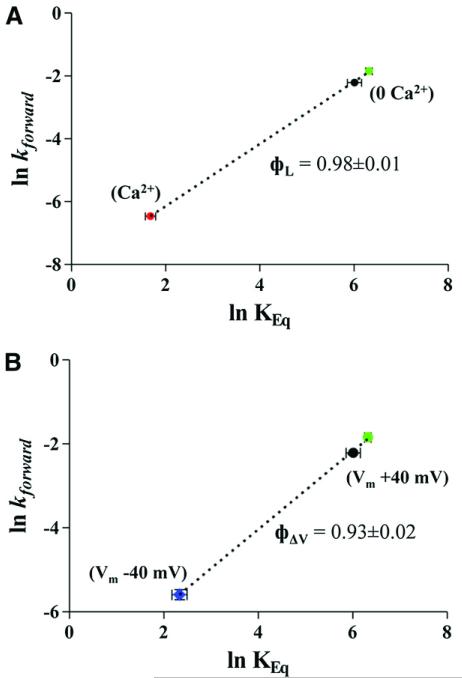
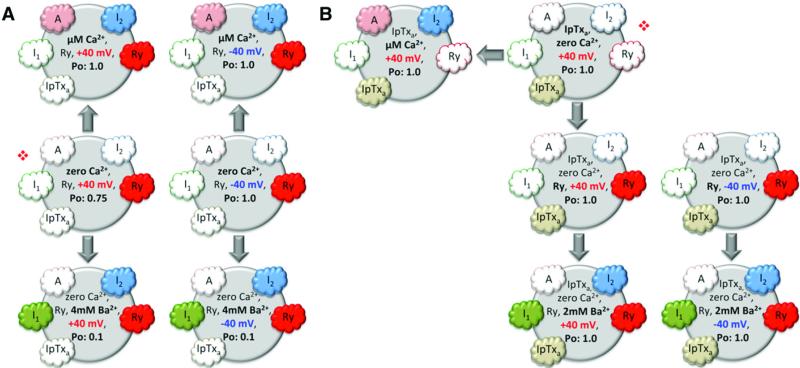
Ryanodine receptors (RyRs) are intracellular membrane channels playing key roles in many Ca(2+) signaling pathways and, as such, are emerging novel therapeutic and insecticidal targets. RyRs are so named because they bind the plant alkaloid ryanodine with high affinity and although it is established that ryanodine produces profound changes in all aspects of function, our understanding of the mechanisms underlying altered gating is minimal. We address this issue using detailed single-channel gating analysis, mathematical modeling, and energetic evaluation of state transitions establishing that, with ryanodine bound, the RyR pore adopts an extremely stable open conformation. We demonstrate that stability of this state is influenced by interaction of divalent cations with both activating and inhibitory cytosolic sites and, in the absence of activating Ca(2+), trans-membrane voltage. Comparison of the conformational stability of ryanodine- and Imperatoxin A-modified channels identifies significant differences in the mechanisms of action of these qualitatively similar ligands.


Figures

Fig. 1
Fig. 1. Voltage dependence of ryanodine-modified RyR2 at zero Ca2+.
Representative single-channel traces are shown in (A–H). Black bars indicate closed levels, gray bars fully open levels, and dotted bars modified levels. An unmodified channel activated by 1 μM (contaminant) cytosolic and luminal (cyt/lum) Ca2+ at +40 mV (A) and −40 mV (B), subsequently modified with 1 μM ryanodine at +40 mV (C). Under these conditions, the Po of the modified channel is high, with only brief closings at both +40 mV (D) and −40 mV (E). Chelation of Ca2+ to nominally zero increases the frequency of closing events to a greater degree at +40 mV (F) than −40 mV (G). These closing events are brief in nature, as shown (H, 10× expanded section of trace F).
Fig. 2
Fig. 2. Kinetic parameters of ryanodine-modified RyR2 gating (A–D) are represented by black bars (1 μM Ca2+) and gray bars (nominally zero Ca2+).
Data are shown as mean ± S.E.M. for n = 9. *P < 0.05, **P < 0.005; n.s, not significant. (A) Po is significantly reduced on removal of Ca2+ at +40 mV compared with −40 mV. (B) Altered Po is not due to a change in closed times (Tc) (difficulty in resolving events at −40 mV in the presence of 1 μM Ca2+ means that Tc was underestimated—see text for details), but instead, (C) due to a decrease in open times (To), which despite occurring at both +40 mV and −40 mV, only translates into a significant change in (D) the frequency of closings at +40 mV.
Fig. 3
Fig. 3. Detailed examination of ryanodine-modified RyR2 gating in the absence of activating Ca2+ at various holding potentials reveals steep voltage dependence.
(A) A sharp decrease in channel activity (Po) is seen when holding potential is switched from negative to positive. The data points (closed circles) were then fitted with a Boltzmann equation (dotted line). Due to low signal-to-noise, it is not possible to accurately record single-channel currents from ryanodine-modified RyR2 below ±20 mV holding potential. The fit of the Boltzmann function was therefore forced to go through the data points near the maximum and minimum levels due to paucity of intermediate data points. This may limit the scope of interpretation from the parameters derived from the fit. (B) Closed times (Tc) plotted against holding potentials (black squares) do not show significant variation, indicating that the character of closing events remains unchanged. (C) Modified channel open times (To) decreased sharply at positive holding potentials when switched from negative but do not show much variation at different voltages with the same polarity. (D) The frequency of closing events increases at positive voltages and is the basis for the decrease in modified channel Po in response to voltage change. Data presented as mean ± S.E.M. with n = 6–9 single-channel experiments for each data point. Error bars, where not visible, are included within the symbol.
Fig. 4
Fig. 4. Fitting of closed and open dwell-time histograms with exponentials allows mechanistic interpretation of single-channel data.
Representative closed (left) and open (right) time distributions plotted as histograms from a single-channel experiment are shown along with their overall fits (solid black curves) and exponential components underneath (gray curves). The membrane potential (±40 mV) and presence/absence of Ca2+ are indicated above the distribution. (A) The dwell-time distribution of the modified channel in the presence of 1 μM Ca2+ at +40 mV was fitted using a single exponential. An insufficient number of events was obtained at −40 mV for an accurate fit. (B) At nominally zero Ca2+, two exponential components each were required for fitting closed and open time histograms when the membrane potential was +40 mV. (C) In the absence of Ca2+ at −40 mV, only one exponential component each was required for fitting closed and open time histograms. These exponential fits were then associated with corresponding closed and open states in gating models at various conditions of Ca2+ and voltage (Schemes I, IIA, and IIB). The parameters of fits from many single-channel experiments are shown in Table 1.
Fig. 5
Fig. 5. Kinetic parameters from simulated single-channel data validate gating models.
(A) Representative traces of simulated single-channel data generated from the gating schemes. Black solid bars on the left represent the closed level, whereas the gray dotted bars denote the ryanodine-modified open level of RyR2. These simulated traces look similar to their actual experimental counterparts (Fig. 1, D, F, and G). As fitted dwell-time distributions and corresponding gating schemes were unavailable for experiments conducted at −40 mV with 1 μM Ca2+ (see Results), simulated traces could not be generated. Analysis of simulated single-channel data shows that the results are in agreement with those obtained from experimental data (see Fig. 2 for experimental data). The kinetic parameters are plotted for holding potentials of ±40 mV (hatched dark gray bars, 1 μM Ca2+; light gray bars, nominally zero Ca2+). All data are shown as mean ± S.E.M. for n = 5 channels. (B) Open probabilities at +40 mV at zero Ca2+ are significantly lower than when Ca2+ is present, or at −40 mV with zero Ca2+. (C) Closed times do not show any variation with changes in Ca2+ or holding potential. (D) The reduction in Po at +40 mV in the absence of Ca2+ is due to a significant decrease in open times (235 ± 56 milliseconds; n = 5) compared with when Ca2+ is present (1.57 ± 0.2 milli-seconds; n = 5). Significant differences are indicated (**P < 0.005).
Fig. 6
Fig. 6. REFER analysis and Φ value estimation from state transitions provide structural insights into mechanisms.
The forward rate constants of the state transitions are plotted against the equilibrium constants on a log-log scale (see Supplemental Methods and Supplemental Fig. 1). The rate constants used and the gating schemes they are derived from are shown in Table 2 and are annotated with superscript “b”. (A) In the presence of activating Ca2+ at +40 mV when the channel has a Po ~1, the forward rate constant is represented by kMC (from Scheme I, red circle in the plot). When Ca2+ is removed, the perturbation results in decreased Po with two similar forward rate constants kM1C1 and kM2C2 from Scheme IIA (black and green circles, respectively). The slope of this plot (dotted line) gives the Φ-value for ligand-induced perturbation of gating (ΦL) = 0.98 ± 0.01 (n = 6). (B) At −40 mV, in the absence of Ca2+, the Po is high and the forward rate constant is kM0C0 from Scheme IIB (blue square). When the holding potential is switched to +40 mV, the Po decreases and the forward rate constants used are the same as in (A) with kM1C1 and kM2C2 from Scheme IIA represented by black and green circles, respectively. The resulting Φ-value on perturbation of gating due to voltage change (ΦΔV) = 0.93 ± 0.02 (n = 6). Error bars, where not visible, are included within the dimensions of the closed circles in the plot. All data are shown as mean ± S.E.M.
Fig. 7
Fig. 7. Cytosolic Ba2+ inhibition of ryanodine-modified channel Po also abolishes voltage dependence.
Representative single-channel traces are shown in (A-F). Black bars, closed; gray dotted bars, modified. Modified gating at nominally zero Ca2+ at +40 mV (A) and −40 mV (B) (see also Fig. 1, F and G). With 2 mM cytosolic Ba2+, Po is decreased at +40 mV (C) and −40 mV (D). Increasing Ba2+ to 4 mM further decreases Po at both +40 mV (E) and −40 mV (F). Current amplitude is slightly decreased at +40 mV due to the higher permeability but lower conductance of Ba2+ compared with K+. Parameters from single-channel analyses are shown in (G-I); blue and red bars represent data at −40 mV and +40 mV, respectively. Data are shown as mean ± S.E.M. of n = 4–6 channels. Symbols denote significant differences (*P < 0.05, **P < 0.005, and ***P < 0.0001). (G) Voltage dependence of Po is abolished with increasing concentrations of Ba2+, which decrease Po at both +40 mV and −40 mV. (H) Ba2+-induced decrease in Po results from an increase in closed times at both +40 mV and −40 mV. This is in contrast to experiments in the absence of Ba2+ in which closed times remain the same (Fig. 1). (I) Open times also decrease significantly with Ba2+-induced inhibition of Po to a similar extent at both +40 mV and −40 mV.
Fig. 8
Fig. 8. Schematic recapitulation of RyR2-gating behavior under different experimental conditions.
The circular cartoon blocks represent the molecular state of the channel: they indicate the channel activity (Po), the ligands interacting with the RyR2 (viz. Ca2+, Ba2+, ryanodine, and IpTxa), and the holding potential (±40 mV). Putative binding sites of various interacting ligands are shown as cartoon clouds along the circumference of the blocks; they are either empty (white) or occupied (colored) by the respective ligand. (A) For an easier interpretation, the schematic begins at the block with the simplest experimental condition and is marked with a red shamrock. Ryanodine-modified RyR2 in the absence of Ca2+ (Ca2+ binding sites A, I1, and I2 are unoccupied) has a lower Po due to an increased frequency of brief closing events at +40 mV when compared with −40 mV. In the presence of 1 mM Ca2+ (top row blocks), the putative high-affinity activation (A) and inhibition sites (I2) on the modified RyR2 are occupied, which increases the channel Po to ~1 both at +40 mV and −40 mV with the disappearance of closing events. However, if the ryanodine-modified channel is instead exposed to high cytosolic Ba2+ (4 mM) in the absence of Ca2+ (arrows pointing downward in the scheme), the channel is strongly inhibited due to Ba2+ occupying both high-affinity (I2) and low-affinity (I1) inhibition sites on the RyR2 (bottom row blocks). Under the influence of Ba2+, voltage dependence of the modified channel gating is abolished (see Discussion for possible mechanisms). (B) The starting block is marked with a red shamrock, as above, to represent the simplest experimental scenario describing the interaction of IpTxa with the channel. In the absence of Ca2+, the IpTxa-modified RyR2 has a very high Po (1.0), with few discernible closing events, but once the toxin unbinds, the channel closes, preventing further binding (Supplemental Fig. 6D). The kinetics of the IpTxa-modified state in the presence of Ca2+ does not change and the Po remains ~1.0 (top row, left block). Downward arrows from the starting point toward conditions in which the RyR2 is modified concomitantly with IpTxa and ryanodine in the absence of Ca2+ at ±40 mV (as seen in Supplemental Fig. 7, C and D). The Po when IpTxa is bound to the ryanodine-modified channel still remains at 1.0 with no noticeable change in the kinetics. In contrast, the ryanodine-modified state exhibits voltage dependence of gating, as seen in (A). When the above conditions are further modified by the addition of mM Ba2+ (bottom row blocks), the IpTxa-modified state of the ryanodine-modified channel remains immune (Po ~1.0) to the inhibitory action of the divalent, whereas the Po of the ryanodine-modified state is drastically reduced at both ±40 mV under these conditions.
Scheme I
Scheme I
Scheme IIA
Scheme IIA
Scheme IIB
Scheme IIB

Similar articles

Cited by

References

    1. Amador FJ, Stathopulos PB, Enomoto M, Ikura M. Ryanodine receptor calcium release channels: lessons from structure-function studies. FEBS J. 2013;280:5456–5470. - PubMed
    1. Armisén R, Sierralta J, Vélez P, Naranjo D, Suárez-Isla BA. Modal gating in neuronal and skeletal muscle ryanodine-sensitive Ca2+ release channels. Am J Physiol. 1996;271:C144–C153. - PubMed
    1. Auerbach A. How to turn the reaction coordinate into time. J Gen Physiol. 2007;130:543–546. - PMC - PubMed
    1. Bers DM. Cardiac excitation-contraction coupling. Nature. 2002;415:198–205. - PubMed
    1. Bezanilla F. How membrane proteins sense voltage. Nat Rev Mol Cell Biol. 2008;9:323–332. - PubMed

Publication types

LinkOut - more resources