. 2014 Jul 22;111(29):10503-8.
doi: 10.1073/pnas.1318416111. Epub 2014 Jul 7.

Irrational exuberance and neural crash warning signals during endogenous experimental market bubbles

Affiliations

Irrational exuberance and neural crash warning signals during endogenous experimental market bubbles

Alec Smith et al. Proc Natl Acad Sci U S A. .

Abstract

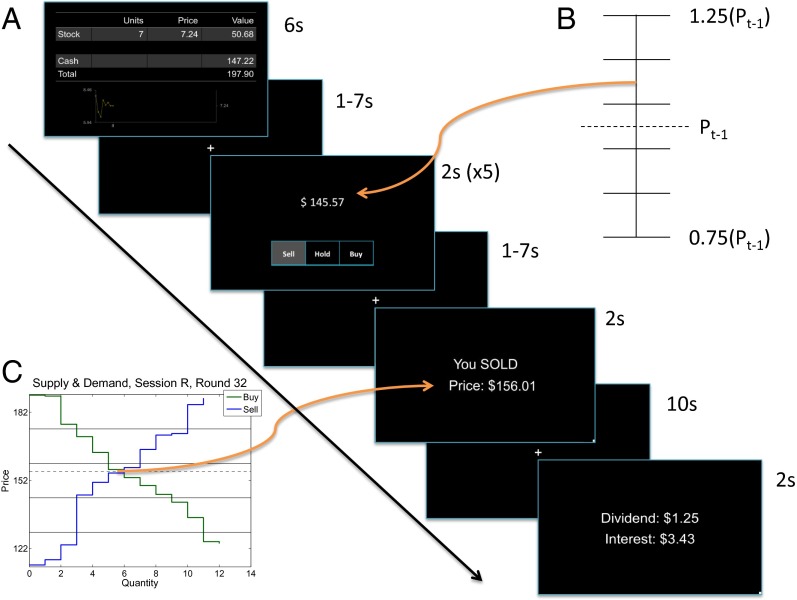
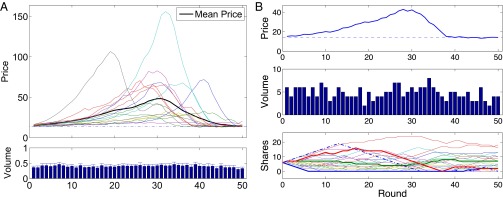
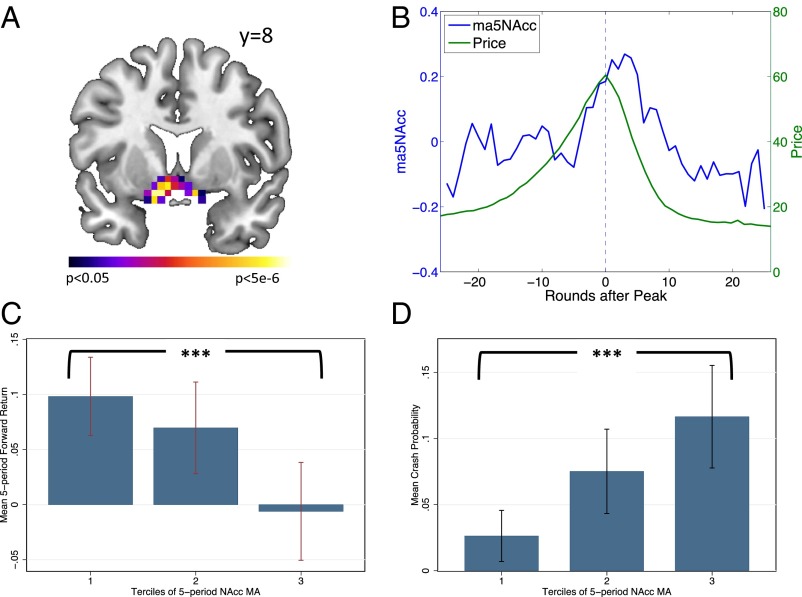
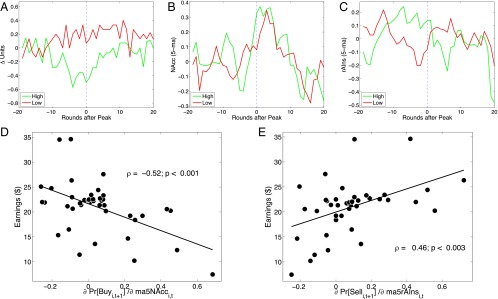
Groups of humans routinely misassign value to complex future events, especially in settings involving the exchange of resources. If properly structured, experimental markets can act as excellent probes of human group-level valuation mechanisms during pathological overvaluations--price bubbles. The connection between the behavioral and neural underpinnings of such phenomena has been absent, in part due to a lack of enabling technology. We used a multisubject functional MRI paradigm to measure neural activity in human subjects participating in experimental asset markets in which endogenous price bubbles formed and crashed. Although many ideas exist about how and why such bubbles may form and how to identify them, our experiment provided a window on the connection between neural responses and behavioral acts (buying and selling) that created the bubbles. We show that aggregate neural activity in the nucleus accumbens (NAcc) tracks the price bubble and that NAcc activity aggregated within a market predicts future price changes and crashes. Furthermore, the lowest-earning subjects express a stronger tendency to buy as a function of measured NAcc activity. Conversely, we report a signal in the anterior insular cortex in the highest earners that precedes the impending price peak, is associated with a higher propensity to sell in high earners, and that may represent a neural early warning signal in these subjects. Such markets could be a model system to understand neural and behavior mechanisms in other settings where emergent group-level activity exhibits mistaken belief or valuation.

Keywords: asset bubbles; hyperscanning; neuroeconomics.


Conflict of interest statement

The authors declare no conflict of interest.

Figures

Fig. 1.
Fig. 1.
Asset market experiment. (A) Each period subjects viewed the following screens, in order: Positions, Order Entry (×5), Trading Results, and Dividends and Interest. (B) Order elicitation procedure. Subjects responded Buy, Sell, or Hold to a random (uniform) price draw from each of five bins, each of width equal to 10% of the last period’s price. The middle bin was centered on the last period’s price. (C) How the price is chosen (=market clearing). The highest price at which subjects responded Buy, and the lowest price at which subjects responded Sell, were entered into a closed book call market. Prices and trading outcomes were reported on the Trading Results screen.
Fig. 2.
Fig. 2.
Endogenous market bubbles. (A) Price paths in16 different experimental market sessions. The dark line shows the average price in each period over the 16 sessions. Plotted below the prices is the normalized per-subject volume for each period; error bars are SEs. (B) Single-session prices (Top) and trading volume (Middle) from one statistically typical experimental session. At Bottom is shown the risky asset holdings; each subject is indicated by a different color. MRI subjects are shown with thicker lines. The dashed line is the “clairvoyant” profit-maximizing share path (assuming subjects could somehow correctly anticipate all future prices).
Fig. 3.
Fig. 3.
Irrational exuberance. (A) GLM results showing the conjunction of neural responses to “You Bought” and “You Sold” messages; P < 0.05 (familywise error corrected). Peak T = 7.69, MNI = [−10, 8, −14]. (B) Average NAcc activity tracks the endogenous market bubble. MA5Nacc (blue) is the average of the five previous periods’ NAcc activity, recentered around the maximal (peak) price in each session. (C) NAcc activity predicts future returns of the risky asset. Earners were divided into three groups, by terciles of earnings. Each bar shows the mean five-period forward return, for each tercile of the five-period moving average of NAcc activity, calculated within session. The mean return in the highest tercile of NAcc activity is significantly less than the mean return in the lowest tercile. (D) NAcc activity within session predicts crashes. Each bar shows the relative frequency of a crash (defined as a price drop of greater than 50%) occurring in the next five periods. The observed incidence of crashes is much greater in the highest tercile of our moving-average NAcc activity signal.
Fig. 4.
Fig. 4.
Individual differences: high and low earners and neurobehavioral metrics. (A) Trading behavior of the highest and lowest earnings terciles, aligned around the market peaks. The y axis plots the mean change in units of the risky asset in each period. These trading curves cross about 10 periods before the peak of the market. The high earners’ sell-off continues unabated until about 10 periods after the peak. (B) The NAcc activity association of prices appears to be consistent across subject groups. The colored lines plot the mean NAcc activity in the highest and lowest terciles of the payout distribution. (C) Average right anterior insula activity in high earners and low earners shows that low earner activity fluctuates around 0, whereas high earner activity shows a peak that coincides with the beginning of the sell-off of units shown in A (5–10 periods before the price peak). We used an ROI centered on MNI [36, 24, 2], corresponding to the peak “risk prediction” signal from ref. . (D) The cost of changing one’s buying probability as a function of the change in activity in the NAcc as read out by earnings. Forty-one scanned subjects are included in this plot. The negative slope shows that tracking the group-defined bubble and committing to it in the form of increased brain-to-buying probability costs money. This defines a neural metric for irrational exuberance and measures it in terms of earnings. (E) Increased propensity to sell based on right anterior insula activity (a neurobehavioral brain-selling relation) is associated with higher earnings. The positive slope shows that subjects whose insula activity is predictive of future selling earn more.

References

    1. Flood RP, Garber PM. Market fundamentals versus price-level bubbles: The first tests. J Polit Econ. 1980;88(4):745–770.
    1. Kindleberger CP, Aliber RZ. Manias, Panics, and Crashes: A History of Financial Crises. Hoboken, NJ: Wiley; 2005.
    1. Shiller R. Irrational Exuberance. 2nd Ed. New York: Broadway Books; 2005.
    1. Ofek E, Richardson M. Dotcom mania: The rise and fall of internet stock prices. J Finance. 2003;58(3):1113–1138.
    1. Akerlof G, Shiller R. Animal Spirits: How Human Psychology Drives the Economy, and Why It Matters for Global Capitalism. Princeton: Princeton Univ Press; 2009.

Publication types