Clinical Trial
. 2014 Jul 22;111(29):10761-6.
doi: 10.1073/pnas.1402663111. Epub 2014 Jul 7.

Effect of sleep deprivation on the human metabolome

Affiliations
Clinical Trial

Effect of sleep deprivation on the human metabolome

Sarah K Davies et al. Proc Natl Acad Sci U S A. .

Abstract

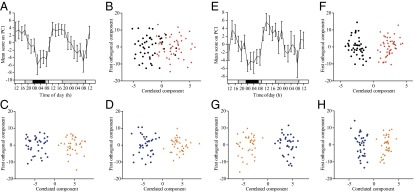
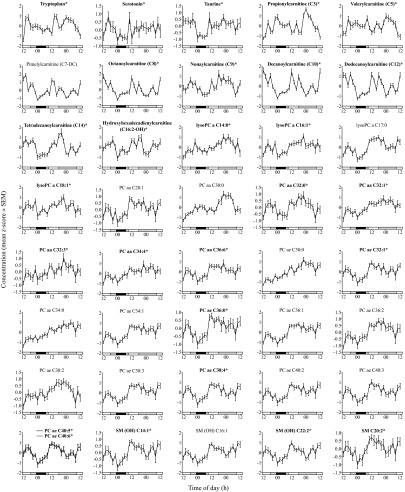
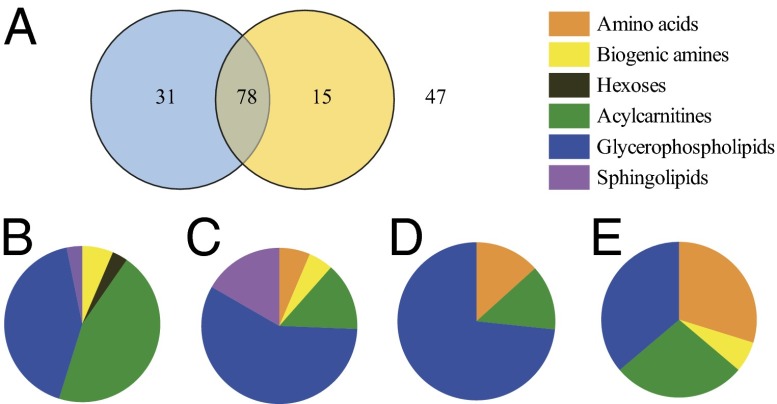
Sleep restriction and circadian clock disruption are associated with metabolic disorders such as obesity, insulin resistance, and diabetes. The metabolic pathways involved in human sleep, however, have yet to be investigated with the use of a metabolomics approach. Here we have used untargeted and targeted liquid chromatography (LC)/MS metabolomics to examine the effect of acute sleep deprivation on plasma metabolite rhythms. Twelve healthy young male subjects remained in controlled laboratory conditions with respect to environmental light, sleep, meals, and posture during a 24-h wake/sleep cycle, followed by 24 h of wakefulness. Two-hourly plasma samples collected over the 48 h period were analyzed by LC/MS. Principal component analysis revealed a clear time of day variation with a significant cosine fit during the wake/sleep cycle and during 24 h of wakefulness in untargeted and targeted analysis. Of 171 metabolites quantified, daily rhythms were observed in the majority (n = 109), with 78 of these maintaining their rhythmicity during 24 h of wakefulness, most with reduced amplitude (n = 66). During sleep deprivation, 27 metabolites (tryptophan, serotonin, taurine, 8 acylcarnitines, 13 glycerophospholipids, and 3 sphingolipids) exhibited significantly increased levels compared with during sleep. The increased levels of serotonin, tryptophan, and taurine may explain the antidepressive effect of acute sleep deprivation and deserve further study. This report, to our knowledge the first of metabolic profiling during sleep and sleep deprivation and characterization of 24 h rhythms under these conditions, offers a novel view of human sleep/wake regulation.

Keywords: biomarker; circadian rhythms; depression; melatonin; total sleep deprivation.


Conflict of interest statement

Conflict of interest statement: D.J.S. has received research support from Philips Lighting. D.J.S. and B.M. are codirectors of Stockgrand. V.L.R. is a scientific advisor to Lumie and has received research support from Philips Lighting.

Figures

Fig. 1.
Fig. 1.
Multivariate analysis of untargeted (AD) and targeted (EH) metabolomics data. (A and E) PCA of all analysis data were carried out, and the change in mean score (±SEM) across all subjects on PC1 with time is shown (A, untargeted; E, targeted). White bars, awake, 90 lx, free to move; gray bars, awake, <5 lx, semirecumbent; black bars, sleeping with eye masks, 0 lx, supine. (B and F) OPLS-DA models separating selected time points according to sleep status (B, untargeted; F, targeted); black circles, sleep, day 1 00:00–06:00 h; red diamonds, sleep deprivation, day 2 00:00–06:00 h). (C, D, G, and H) OPLS-DA models (validated by permutation analysis) in which selected time periods were classed according to time of day (blue circles, 02:00–06:00 h; orange triangles, 14:00–18:00 h). This analysis was carried out for day 1 (C, untargeted; G, targeted) and day 2 (D, untargeted; H, targeted).
Fig. 2.
Fig. 2.
Concentrations of 41 individual metabolites (z-score mean ± SEM) found at significantly higher levels (P < 0.05, q < 0.05) during sleep deprivation compared with during sleep (00:00–06:00 h). Asterisks and bold labels denote metabolites only showing significant changes between the sleep and sleep-deprivation (00:00–06:00 h) conditions. The metabolites not annotated also changed significantly (P < 0.05, q < 0.05) between wake periods (14:00–22:00 h) on day 1 and day 2. White bars, awake, 90 lx, free to move; gray bars, awake, < 5 lx, semirecumbent; black bars, sleeping with eye masks, 0 lx, supine.
Fig. 3.
Fig. 3.
(A) Venn diagram showing the number of metabolites exhibiting a significant fit to a cosine curve on day 1 (left circle, blue), day 2 (right circle, yellow), both days (n = 78), or neither (n = 47). (BE) Pie charts showing the proportion of metabolites from each metabolite class [exhibiting a significant fit to a cosine curve on day 1 only (B), on days 1 and day 2 (C), on day 2 only (D), and on neither day (E)].

Similar articles

Cited by

References

    1. Mohawk JA, Green CB, Takahashi JS. Central and peripheral circadian clocks in mammals. Annu Rev Neurosci. 2012;35:445–462. - PMC - PubMed
    1. Green CB, Takahashi JS, Bass J. The meter of metabolism. Cell. 2008;134(5):728–742. - PMC - PubMed
    1. Bass J, Takahashi JS. Circadian integration of metabolism and energetics. Science. 2010;330(6009):1349–1354. - PMC - PubMed
    1. Eckel-Mahan K, Sassone-Corsi P. Metabolism and the circadian clock converge. Physiol Rev. 2013;93(1):107–135. - PMC - PubMed
    1. Bass J, Turek FW. Sleepless in America: A pathway to obesity and the metabolic syndrome? Arch Intern Med. 2005;165(1):15–16. - PubMed

Publication types