. 2014 Aug 22;289(34):23796-808.
doi: 10.1074/jbc.M114.577387. Epub 2014 Jul 7.

MicroRNA-130a is up-regulated in mouse liver by iron deficiency and targets the bone morphogenetic protein (BMP) receptor ALK2 to attenuate BMP signaling and hepcidin transcription

Affiliations

MicroRNA-130a is up-regulated in mouse liver by iron deficiency and targets the bone morphogenetic protein (BMP) receptor ALK2 to attenuate BMP signaling and hepcidin transcription

Kimberly B Zumbrennen-Bullough et al. J Biol Chem. .

Abstract

Systemic iron balance is controlled by the liver peptide hormone hepcidin, which is transcriptionally regulated by the bone morphogenetic protein (BMP)-SMAD pathway. In iron deficiency, liver BMP-SMAD signaling and hepcidin are suppressed as a compensatory mechanism to increase iron availability. MicroRNAs are small regulatory RNAs that have an increasingly recognized role in many biologic processes but are only recently implicated in iron homeostasis regulation. Here, we demonstrate that liver expression of the microRNA miR-130a is up-regulated by iron deficiency in mice. We identify the BMP6-SMAD signaling pathway as a functional target of miR-130a in hepatoma-derived Hep3B cells. Although the TGF-β/BMP common mediator SMAD4 was previously reported to be an miR-130a target to inhibit TGF-β signaling, we do not confirm SMAD4 as an miR-130a target in our biologic system. Instead, we determine that the BMP type I receptor ALK2 is a novel target of miR-130a and that miR-130a binds to two specific sites in the 3'-untranslated region to reduce ALK2 mRNA stability. Moreover, we show in mice that the increased liver miR-130a during iron deficiency is associated with reduced liver Alk2 mRNA levels. Finally, we demonstrate that down-regulation of ALK2 by miR-130a has a functional effect to inhibit BMP6-induced hepcidin transcription in Hep3B cells. Our data suggest that iron deficiency increases liver miR-130a, which, by targeting ALK2, may contribute to reduce BMP-SMAD signaling, suppress hepcidin synthesis, and thereby promote iron availability.

Keywords: ALK2; Activin A Receptor, Type I (ACVR1); Bone Morphogenetic Protein (BMP); Hepcidin; Iron Metabolism; MicroRNA (miRNA); SMAD Transcription Factor; SMAD4; Signal Transduction; miR-130a.


Figures

FIGURE 1.
FIGURE 1.
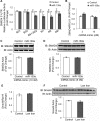
Low iron diet increases liver miR-130a in mice. A, liver miR-130a, Rnu5g, and miR-103 were measured by qRT-PCR in 12-week-old male and female 129S6/SvEvTac mice after receiving a control diet (Ctrl) or a low iron diet (Low Iron) for 5 weeks (n = 5–6 per group). B–D, liver tissue from 9-week-old female C57BL/6 mice (n = 8 per group) treated with a control (Ctrl) or a low iron diet (Low Iron) for 5 weeks were analyzed for miR-130a, Rnu5g, and miR-130a by qRT-PCR (B), p-Smad1/5/8 and total Smad1 relative to actin protein expression by immunoblot (IB) and chemiluminescence quantification (C), and Bmp6, Id1, and Hamp relative to Rpl19 mRNA expression by qRT-PCR (D). Results are reported as mean ± S.E. of the fold change relative to the control group. *, p < 0.05; **, p < 0.01; ***, p < 0.001.
FIGURE 2.
FIGURE 2.
miR-130a inhibits BMP6-SMAD signaling in hepatoma-derived cells. A, endogenous miR-130a levels relative to the small RNA RNU5G were quantified by qRT-PCR in hepatoma-derived Hep3B, HepG2, and Hepa 1–6 cells. Data are reported as the mean fold change ± S.E. relative to HepG2 cells; ND indicates not detectable. B, Hep3B, HepG2, and Hepa 1–6 cells were treated for 17 h without (black bars) or with 50 ng/ml BMP6 (white bars), followed by measurement of ID1 relative to RPL19 mRNA by qRT-PCR. Results are reported as mean ± S.E. of the fold change from untreated cells. C, Hep3B cells were transfected with increasing concentrations of miR-130a mimic and treated with 5 ng/ml BMP6 for 17 h, followed by measurement of miR-130a levels by qRT-PCR. Results are reported as the mean fold change ± S.E. relative to 0.5 nm miR-130a treated cells. D and G, Hep3B cells were transfected with BRE-Luc and control Renilla luciferase vector (D) or mock-transfected (G) and were treated without (black bar) or with 5 ng/ml BMP6 (white bar) for 17 h, followed by measurement of relative luciferase activity (D) or ID1 relative to RPL19 mRNA by qRT-PCR (G). Results are reported as mean ± S.E. of the fold change from untreated cells. E, Hep3B cells were transfected with BRE-Luc and a control Renilla luciferase vector in combination with increasing concentrations of miR-130a (gray bars) or negative control mimic (white bars) and were treated with 5 ng/ml BMP6 for 17 h, followed by measurement of relative luciferase activity. Results are reported as the mean fold change ± S.E. relative to the negative control at each concentration. F and H, Hep3B cells were transfected with miR-130a (gray bars) or negative control mimic (white bars) and were treated without or with 5 ng/ml BMP6 for 17 h, followed by measurement of phosphorylated SMAD1/5/8 (p-SMAD1/5/8) and total SMAD1 relative to actin by immunoblot (IB) and chemiluminescence quantification (F) or ID1 relative to RPL19 mRNA by qRT-PCR (H). Results are reported as the mean fold change ± S.E. relative to control at each concentration. A, results are shown for two experiments, each performed in triplicate. C, results are shown from one of two experiments performed in triplicate. For all other panels, n = 3–4 experiments, each performed in duplicate (for some immunoblots) or triplicate (for all other experiments); *, p < 0.05; **, p < 0.01; ***, p < 0.001. A representative immunoblot is shown.
FIGURE 3.
FIGURE 3.
miR-130a mimic does not target the 3′UTR of SMAD4. A, SMAD4 3′UTR relative luciferase activity was measured by Dual-Luciferase assay in Hep3B cells transfected with 10 nm miR-130a (gray bars) or negative control mimic (white bars), in combination with control Renilla luciferase reporter and an engineered SMAD4 3′UTR firefly luciferase construct containing the proximal miR-130a binding site (BS1), the distal binding site (BS2), the two predicted miR-130a-binding sites cloned side-by-side (BS1-BS2), or a BS1-BS2 construct with mutations in the proximal (M1), distal (M2), or both predicted binding sites (DM). B–D, Hep3B (B and C) or HEK293 (D) cells were transfected with the indicated concentration of miR-130a (gray bars) or negative control mimic (white bars) and were treated for 17 h with 5 ng/ml BMP6, followed by measurement of SMAD4 relative to RPL19 mRNA by qRT-PCR (B) or SMAD4 relative to actin protein by immunoblot and chemiluminescence quantitation (C and D). A–D, results are reported as the mean fold change ± S.E. relative to negative control; n = 3–5 experiments, each performed in duplicate (C) or triplicate (A, B, and D). Representative immunoblots are shown. E and F, liver tissue from mice treated with a control (Control) or a low iron diet (Low Iron) as described in Fig. 1, B–D, were analyzed for Smad4 relative to Rpl19 mRNA (E) and Smad4 relative to actin protein expression by immunoblot and chemiluminescence quantification (F). Results are reported as the mean fold change ± S.E. relative to the control group. For all panels, significance is indicated by *, p < 0.05; **, p < 0.01.
FIGURE 4.
FIGURE 4.
miR-130a mimic decreases the half-life of ALK2 mRNA by targeting two predicted binding sites in the 3′UTR. A and B, ALK2 3′UTR relative luciferase activity was measured by Dual-Luciferase assay in Hep3B cells transfected with the indicated concentrations (A) or 10 nm (B) of miR-130a (gray bars) or negative control mimic (white bars), in combination with control Renilla luciferase reporter and full-length wild type (A and B, Wt) or mutant ALK2 3′UTR firefly luciferase reporters containing mutations in the proximal (M1), distal (M2), or both (DM) predicted binding sites. Results are reported as the mean fold change ± S.E. relative to the negative control at each concentration; n = 3–9 experiments, each performed in triplicate. C, Hep3B cells were transfected with the indicated concentration of miR-130a (gray bars) or negative control mimic (white bars) and treated for 17 h with 5 ng/ml BMP6, followed by measurement of ALK2 relative to RPL19 mRNA by qRT-PCR. Results are reported as the mean fold change ± S.E. compared with control; n = 3 experiments each performed in triplicate. D, Hep3B cells were transfected with 10 nm miR-130a or negative control mimic. Twenty four hours after transfection, cells were treated with actinomycin D for 0–7 h, followed by measurement of ALK2 relative to RPL19 mRNA by qRT-PCR. Results are reported as mean ± S.E. of fold change compared with the 0 time point for each condition. Half-life (t½) calculations are based on three independent experiments, each performed in triplicate. One representative experiment is shown. E, liver tissue from mice treated with a control (Control) or a low iron diet (Low Iron) as described in Fig. 1, B–D, were analyzed for Alk2 relative to Rpl19 mRNA. Results are reported as the mean fold change ± S.E. relative to the control group. **, p < 0.01, and ***, p < 0.001.
FIGURE 5.
FIGURE 5.
miR-130a mimic inhibits BMP6 induction of hepcidin expression in Hep3B cells. A and C, Hep3B cells were transfected with Hep-Luc and control Renilla luciferase vector (A) or mock-transfected (C) and were treated without (black bar) or with 5 ng/ml BMP6 (white bar) for 17 h, followed by measurement of relative luciferase activity (A) or HAMP relative to RPL19 mRNA by qRT-PCR (C). Results are reported as the mean fold change ± S.E. relative to untreated cells. B, Hep3B cells were transfected with Hep-Luc and control Renilla luciferase vector, in combination with increasing concentrations of miR-130a (gray bars) or negative control mimic (white bars) and were treated with 5 ng/ml BMP6 for 17 h, followed by measurement of relative luciferase activity. Results are reported as the mean fold change ± S.E. relative to negative control at each concentration. D, Hep3B cells were transfected with 3 or 10 nm miR-130a (gray bars) or negative control mimic (white bars) and were treated with 5 ng/ml BMP6 for 17 h, followed by measurement of HAMP relative to RPL19 mRNA by qRT-PCR. Results are reported as the mean fold change ± S.E. relative to the negative control at each concentration. For all panels, n = 3 experiments each performed in triplicate. **, p < 0.01, and ***, p < 0.001.
FIGURE 6.
FIGURE 6.
Transfection with ALK2 lacking the native 3′UTR partially reverses the inhibitory effect of miR-130a mimic on BMP6-stimulated hepcidin expression in Hep3B cells. Hep3B cells were transfected with empty vector (EV, white bars), ALK2 cDNA containing an HA tag without (ALK2-HA, dark gray bars) or with the native 3′UTR (ALK2-HA-3′UTR, light gray bars) alone (A–C, E, and F) or in combination with Hep-Luc and Renilla luciferase vectors (D), and the indicated concentrations of miR-130a mimic (C–F). Transfected cells were treated with 5 ng/ml BMP6 for 17 h, followed by measurement of ALK2 relative to RPL19 mRNA by qRT-PCR (A and C), ALK2-HA and actin protein expression by immunoblot (IB) (B), relative luciferase activity (D), and HAMP relative to RPL19 by qRT-PCR (E and F). Results are reported as the mean fold change ± S.E. relative to empty vector transfected cells (A) or to 0 nm miR-130a mimic for each construct (C–F). B, one of two experiments is shown performed in triplicate. For all other panels, n = 3–5 experiments each performed in triplicate. C, ***, p < 0.001 relative to 0 nm miR-130a mimic. For all other panels, *, p < 0.05; **, p < 0.01; and ***, p < 0.001 relative to empty vector at a given miR-130a mimic concentration or for other pairwise comparisons as indicated. NS, not significant.
FIGURE 7.
FIGURE 7.
Schematic diagram depicting the proposed role of miR-130a in BMP-SMAD signaling and hepcidin regulation under iron-deficient conditions. Under control conditions (left panel), BMP6 binds to the BMP type I receptor ALK2 or ALK3, the BMP type II receptor ACTRIIA, and the co-receptor HJV to induce phosphorylation of SMAD1/5/8 proteins, which complex with common mediator SMAD4 to increase transcription of hepcidin mRNA in hepatocytes. Hepcidin is secreted into the circulation to inhibit ferroportin (FPN) cell surface expression and decrease iron entry into the bloodstream. Under iron-deficient conditions (right panel), liver miR-130a expression is increased and targets the 3′UTR of ALK2 to inhibit expression. This acts in conjunction with a reduction in BMP6 mRNA expression and an increase in matriptase 2 (MTP2) protein expression (which is proposed to cleave HJV) to decrease signaling through the BMP-SMAD pathway, decrease hepcidin expression, increase ferroportin expression, and thereby increase iron availability.

Similar articles

Cited by

References

    1. Ganz T., Nemeth E. (2012) Hepcidin and iron homeostasis. Biochim. Biophys. Acta 1823, 1434–1443 - PMC - PubMed
    1. Babitt J. L., Huang F. W., Wrighting D. M., Xia Y., Sidis Y., Samad T. A., Campagna J. A., Chung R. T., Schneyer A. L., Woolf C. J., Andrews N. C., Lin H. Y. (2006) Bone morphogenetic protein signaling by hemojuvelin regulates hepcidin expression. Nat. Genet. 38, 531–539 - PubMed
    1. Andriopoulos B., Jr., Corradini E., Xia Y., Faasse S. A., Chen S., Grgurevic L., Knutson M. D., Pietrangelo A., Vukicevic S., Lin H. Y., Babitt J. L. (2009) BMP6 is a key endogenous regulator of hepcidin expression and iron metabolism. Nat. Genet. 41, 482–487 - PMC - PubMed
    1. Meynard D., Kautz L., Darnaud V., Canonne-Hergaux F., Coppin H., Roth M. P. (2009) Lack of the bone morphogenetic protein BMP6 induces massive iron overload. Nat. Genet. 41, 478–481 - PubMed
    1. Yu P. B., Hong C. C., Sachidanandan C., Babitt J. L., Deng D. Y., Hoyng S. A., Lin H. Y., Bloch K. D., Peterson R. T. (2008) Dorsomorphin inhibits BMP signals required for embryogenesis and iron metabolism. Nat. Chem. Biol. 4, 33–41 - PMC - PubMed

Publication types

LinkOut - more resources