. 2014 Sep 5;289(36):25276-86.
doi: 10.1074/jbc.M114.575985. Epub 2014 Jul 7.

Phosphorylation and degradation of tomosyn-2 de-represses insulin secretion

Affiliations

Phosphorylation and degradation of tomosyn-2 de-represses insulin secretion

Sushant Bhatnagar et al. J Biol Chem. .

Abstract

The abundance and functional activity of proteins involved in the formation of the SNARE complex are tightly regulated for efficient exocytosis. Tomosyn proteins are negative regulators of exocytosis. Tomosyn causes an attenuation of insulin secretion by limiting the formation of the SNARE complex. We hypothesized that glucose-dependent stimulation of insulin secretion from β-cells must involve reversing the inhibitory action of tomosyn. Here, we show that glucose increases tomosyn protein turnover. Within 1 h of exposure to 15 mM glucose, ~50% of tomosyn was degraded. The degradation of tomosyn in response to high glucose was blocked by inhibitors of the proteasomal pathway. Using (32)P labeling and mass spectrometry, we showed that tomosyn-2 is phosphorylated in response to high glucose, phorbol esters, and analogs of cAMP, all key insulin secretagogues. We identified 11 phosphorylation sites in tomosyn-2. Site-directed mutagenesis was used to generate phosphomimetic (Ser → Asp) and loss-of-function (Ser → Ala) mutants. The Ser → Asp mutant had enhanced protein turnover compared with the Ser → Ala mutant and wild type tomosyn-2. Additionally, the Ser → Asp tomosyn-2 mutant was ineffective at inhibiting insulin secretion. Using a proteomic screen for tomosyn-2-binding proteins, we identified Hrd-1, an E3-ubiquitin ligase. We showed that tomosyn-2 ubiquitination is increased by Hrd-1, and knockdown of Hrd-1 by short hairpin RNA resulted in increased abundance in tomosyn-2 protein levels. Taken together, our results reveal a mechanism by which enhanced phosphorylation of a negative regulator of secretion, tomosyn-2, in response to insulin secretagogues targets it to degradation by the Hrd-1 E3-ubiquitin ligase.

Keywords: Diabetes; Insulin; Insulin Secretion; SNARE Proteins; Type 2 Diabetes.


Figures

FIGURE 1.
FIGURE 1.
Glucose promotes turnover of tomosyn protein. A, primary human islets were infected with adenovirus containing tomosyn-2 or LacZ at 200 multiplicities of infection in 8 mm glucose for 48 h in standard supplemented RPMI 1640 growth medium. Following incubation, glucose-stimulated insulin secretion was performed as described under “Experimental Procedures.” Fractional insulin secretion in response to varying concentrations of glucose from tomosyn-2-infected cells was normalized to that of cells infected with LacZ control. Values are means ± S.E. of N ≥4. *, p ≤ 0.05 for the fold change in fractional insulin secretion from cells overexpressing tomosyn-2 versus LacZ. NS, not significant. B, INS1 (832/13) cells were cultured overnight in RPMI 1640 growth media containing 3 mm glucose. Following incubation, 50 μm cycloheximide was added to the cells. After 2 h, cells were either treated with 3 or 15 mm glucose, and samples were collected for protein measurement at various time points. The abundance of tomosyn protein was determined using anti-tomosyn antibody. The graph shows relative abundance of tomosyn at 3 and 15 mm glucose. Values are means ± S.E. of N ≥4. *, p ≤ 0.05 for the tomosyn protein abundance in cells treated with 15 mm glucose versus 3 mm. The protein abundance of tomosyn at time = 0 was set to one for both glucose concentrations and was normalized to a nonspecific band. C, INS1 (832/13) cells were cultured overnight in standard supplemental RPMI 1640 growth media containing 3 mm glucose. Following incubation, cells were treated with 15 mm glucose in the presence and absence of 50 μm MG132 for 4 h. Samples were collected for protein measurements. Protein abundance of tomosyn was determined, and data were normalized to β-actin. The graph shows relative abundance of tomosyn. Values are means ± S.E. of n = 4. *, p ≤ 0.05 for the change in tomosyn protein abundance over 4 h in cells treated with 15 mm glucose. NS, not significant.
FIGURE 2.
FIGURE 2.
Phosphorylation of tomosyn-2 by insulin secretagogues. INS1 (832/13) cells were transfected with a mammalian expression plasmid containing tomosyn-2-V5. Following 24 h post-transfection, cells were incubated overnight in 3 mm glucose. After 16 h, A, cells were labeled in a phosphate-free buffer with 0.2 mCi/ml of [32P]orthophosphoric acid for 2 h. Glucose was added to the cells for 30 min. Lysates were prepared, and tomosyn-2-V5 was immunoprecipitated by using an anti-V5 antibody. Incorporation of 32P in tomosyn-2 was measured by autoradiography. Abundance of total tomosyn-2 was determined by immunoblot using anti-V5 antibody. The blot is representative of three independent experiments. B, annotated spectra for the peptide bearing the phosphorylation site in tomosyn-2 at Ser-795. C, cells were treated for 30 min in the presence of secretagogues. Three different treatment groups used in the experiments are as follows: (a) 1.5 or 15 mm glucose; (b) 7 mm glucose or 7 mm glucose with 3 mm 8-Br-cAMP; and (c) glucose 1.5 mm or glucose 1.5 mm with 1 μm TPA. Samples harvested for protein were subjected to immunoprecipitation for b-tomosyn-2-myc followed by mass spectrometry. Top, mass spectrometry results for the relative change in phosphorylation measured at each site between the listed treatment and control as log of means ± log of S.D. from two independent experiments. * represents data from one experiment. Bottom, additional regulatory candidate phosphorylation sites that were detected by mass spectrometry but were not confidently localized or quantified or did not exhibit changes in phosphorylation between conditions. D, modeled tomosyn-2 structure showing phosphorylation sites. Tomosyn-2 structural modeling was conducted using the I-TASSER protein structure prediction server. Specifically, homology modeling was carried out based on the yeast Sro7 crystal structure. Site Ser-768 was included to make alanine and aspartate mutations and to generate a potential AMPK site predicted by ExPASy Motif Scan.
FIGURE 3.
FIGURE 3.
Effect of Ser → Asp-tomosyn-2 mutant on insulin secretion. INS1 (832/13) cells were transfected with WT, Ser → Ala (SA), or Ser → Asp (SD) mutant of tomosyn-2-V5. Post-transfection, cells were cultured in 3 mm glucose culture media. A, cell lysates were prepared, and tomosyn-2-V5 protein abundance was measured by using anti-V5 antibody. The graph shows relative protein abundance of WT, Ser → Ala, and Ser → Asp mutant of tomosyn-2. Protein abundance of β-actin was used as a loading control. *, p ≤ 0.05, and #, p ≤ 0.05 for the protein abundance of Ser → Asp tomosyn-2 mutant compared with WT tomosyn-2 and Ser → Ala tomosyn-2, respectively. ^, p ≤ 0.05 for the protein abundance of Ser → Ala tomosyn-2 mutant compared with WT tomosyn-2. Values are means ± S.E. of n = 5. B, relative mRNA abundance was determined by real time PCR of the cDNA. The ΔCt was calculated by subtracting raw Ct of tomosyn-2 gene from the raw Ct of the β-actin gene. C, fractional insulin secretion in response to 3 mm 8-Br-cAMP at 3 mm glucose from WT, Ser → Ala, or Ser → Asp-tomosyn-2 transfected cells was normalized to that of cells transfected with GFP. Values are means ± S.E. of n = 4. *, p ≤ 0.05 for the fractional insulin secretion from the cells overexpressing WT and Ser → Ala tomosyn-2 versus GFP expressing cells. D, HEK293FT cells were transfected with WT, Ser → Ala, or Ser → Asp-tomosyn-2. Cell lysates were prepared, and tomosyn-2 protein abundance was measured using anti-V5 antibody. Protein abundance of β-actin was used loading control. The graph shows relative protein abundance of WT, Ser → Ala, and Ser → Asp mutant of tomosyn-2. The data are representative of three independent experiments.
FIGURE 4.
FIGURE 4.
Tomosyn-2 is ubiquitinated by high glucose. A, HEK293FT cells were co-transfected with plasmids expressing HA-Ub and tomosyn-2-myc. After 36 h, 50 μm MG132 was added for 2 h. Cells were harvested for total protein. Immunoprecipitation (IP) was performed by using anti-Myc or control anti-IgG antibody. Ubiquitination and the abundance of tomosyn-2 were determined by Western blot by using anti-Myc and anti-ubiquitin (Ub) antibodies, respectively. B, INS1 (832/13) cells were transfected with plasmid expressing tomosyn-2-V5. After 24 h, cells were cultured in growth media containing 3 mm glucose. Next day, cells were treated with 50 μm MG132 or DMSO at 3 and 15 mm glucose. Cells were harvested for total protein. Immunoprecipitation was performed using anti-V5 antibody. Ubiquitination and the abundance of tomosyn-2 were determined by Western blot by using anti-V5 and anti-ubiquitin antibodies, respectively. The data are representative of three independent experiments in A and B.
FIGURE 5.
FIGURE 5.
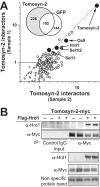
Hrd-1 binds to tomosyn-2. A, INS1 (832/13) cells were transfected with plasmid expressing tomosyn-2-myc. After 36 h, cells were incubated at 1.5 mm glucose for 2 h in KRB. Following a preincubation step, cells were treated with 1 μm phorbol ester (TPA) at 1.5 mm. Cells were harvested for total protein. Immunoprecipitation for tomosyn-2 was performed using protein A-conjugated anti-Myc antibody. Samples were subjected to mass spectrometry. The Venn diagram in the inset of the graph shows the number of proteins identified as tomosyn-2 or GFP-binding partners. The graph shows fold increase in the tomosyn-2 binding partners in response to TPA from two independent experiments. Furthermore, the specificity of binding was measured by comparing the relative abundance of the isobaric reporter ion for a protein in the anti-tomosyn-2 compared with that of the anti-IgG control. B, HEK293FT cells were co-transfected with plasmid expressing Hrd-1 and tomosyn-2-myc. After 36 h, cells were harvested for total protein. Co-immunoprecipitation (IP) was performed. Abundance of Hrd-1 and tomosyn-2 were determined by Western blot by using anti-Hrd-1 and anti-Myc antibodies, respectively. Anti-IgG was used as a control for specificity. The blot is representative of four independent experiments.
FIGURE 6.
FIGURE 6.
Hrd-1 is an E3-ubiquitin ligase for tomosyn-2. A, INS1 (832/13) cells were co-transfected with plasmid expressing tomosyn-2-V5 along with GFP, Hrd-1 (wild type), or Hrd-1-dominant negative (DN). After 24 h, cells were incubated in growth media containing 3 mm glucose for 16 h. Next day, cells were treated with 11 mm glucose in the presence of 50 μm MG132 for 2 h. Cells were harvested for total protein. Immunoprecipitation (IP) was performed using anti-V5 antibody. The abundance of tomosyn-2, Hrd-1, and ubiquitin was determined by using anti-V5, anti-Hrd-1, and anti-ubiquitin antibodies, respectively. The data are representative of three independent experiments. WB, Western blot. ns, nonspecific band. B, HEK293FT cells were co-transfected with plasmid expressing tomosyn-2-myc with negative control shRNA or shHrd-1. Cells were harvest for total protein at 24, 48, and 72 h post-transfection. The abundance of tomosyn-2 and actin was determined by Western blot by using anti-Myc and anti-actin antibody, respectively. Graph shows relative protein abundance of tomosyn-2 normalized to actin. The abundance of tomosyn-2 after 24 h was set to one. Values are means ± S.E. of N ≥4. *, p ≤ 0.05 for the tomosyn-2 protein abundance in cells treated with shHrd-1 versus control shRNA.

Similar articles

Cited by

References

    1. Barbosa R. M., Silva A. M., Tomé A. R., Stamford J. A., Santos R. M., Rosário L. M. (1998) Control of pulsatile 5-HT/insulin secretion from single mouse pancreatic islets by intracellular calcium dynamics. J. Physiol. 510, 135–143 - PMC - PubMed
    1. Eddlestone G. T., Oldham S. B., Lipson L. G., Premdas F. H., Beigelman P. M. (1985) Electrical activity, cAMP concentration, and insulin release in mouse islets of Langerhans. Am. J. Physiol. 248, C145–C153 - PubMed
    1. Rorsman P., Eliasson L., Renström E., Gromada J., Barg S., Göpel S. (2000) The cell physiology of biphasic insulin secretion. News Physiol. Sci. 15, 72–77 - PubMed
    1. Straub S. G., Sharp G. W. (2002) Glucose-stimulated signaling pathways in biphasic insulin secretion. Diabetes Metab. Res. Rev. 18, 451–463 - PubMed
    1. Sudhof T. C. (2004) The synaptic vesicle cycle. Annu. Rev. Neurosci. 27, 509–547 - PubMed

Publication types

MeSH terms