. 2014 Jul 7;206(1):97-112.
doi: 10.1083/jcb.201401063.

Rac1 and Aurora A regulate MCAK to polarize microtubule growth in migrating endothelial cells

Affiliations

Rac1 and Aurora A regulate MCAK to polarize microtubule growth in migrating endothelial cells

Alexander Braun et al. J Cell Biol. .

Abstract

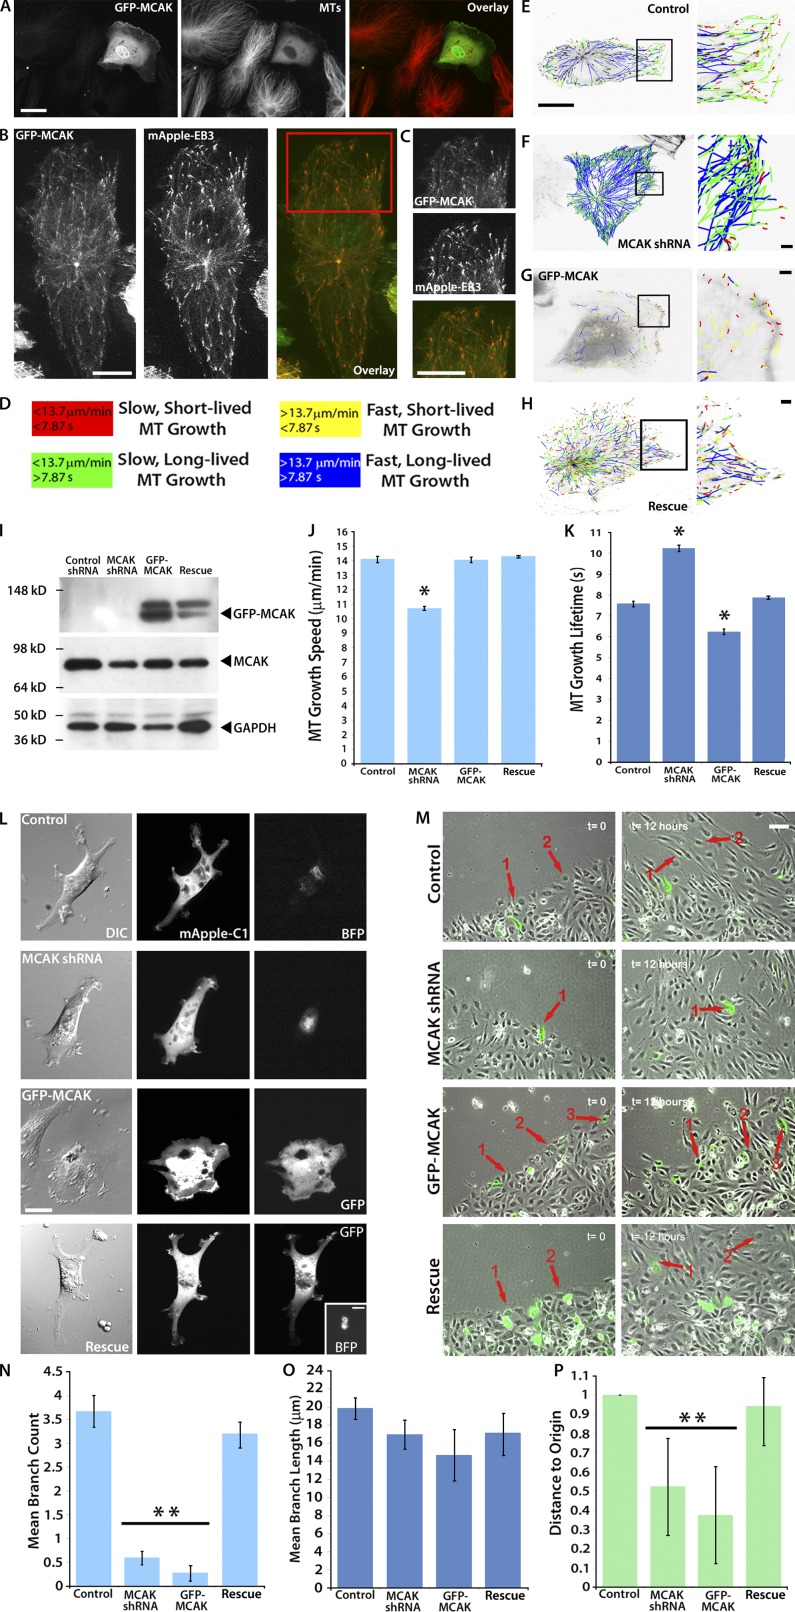
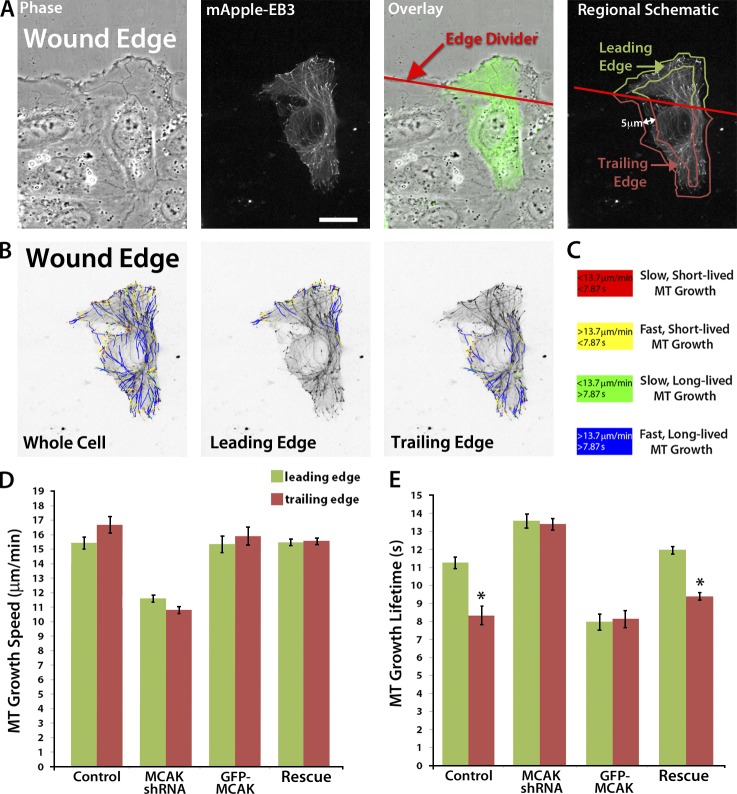
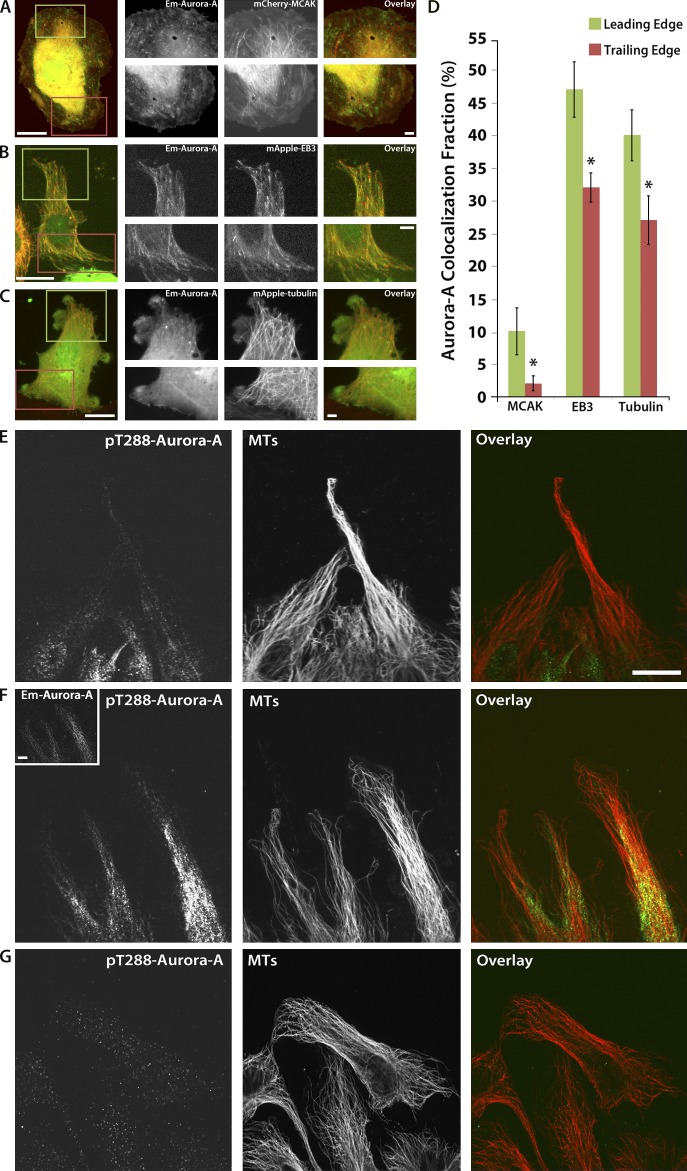
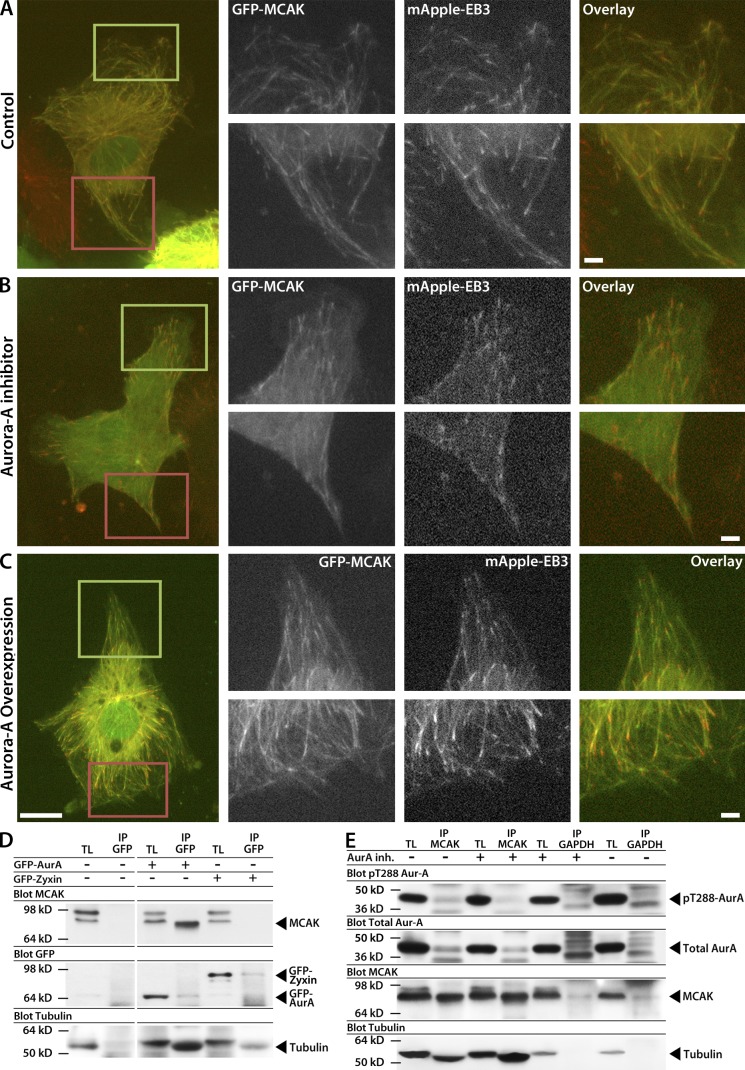
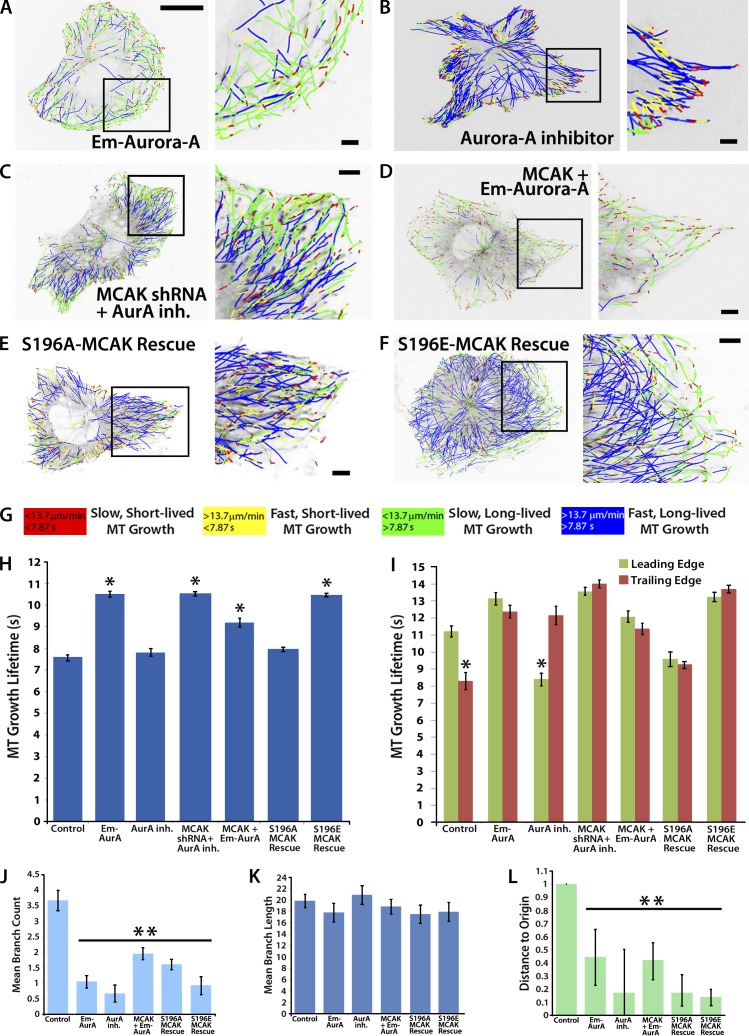
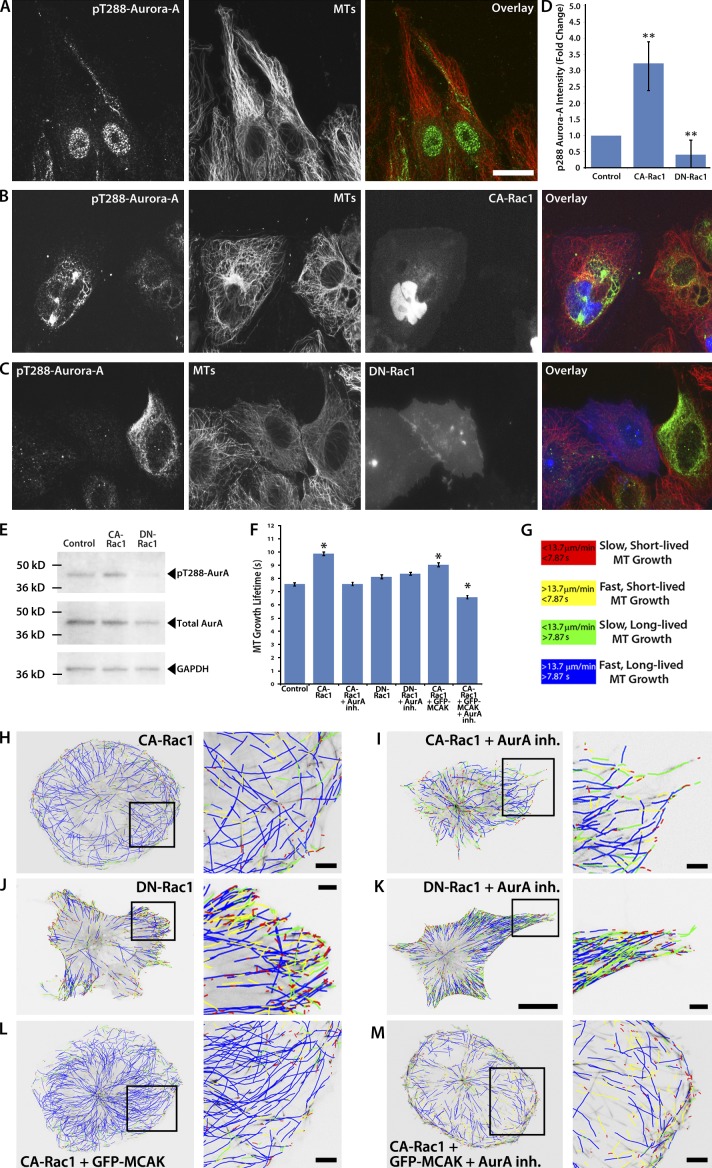
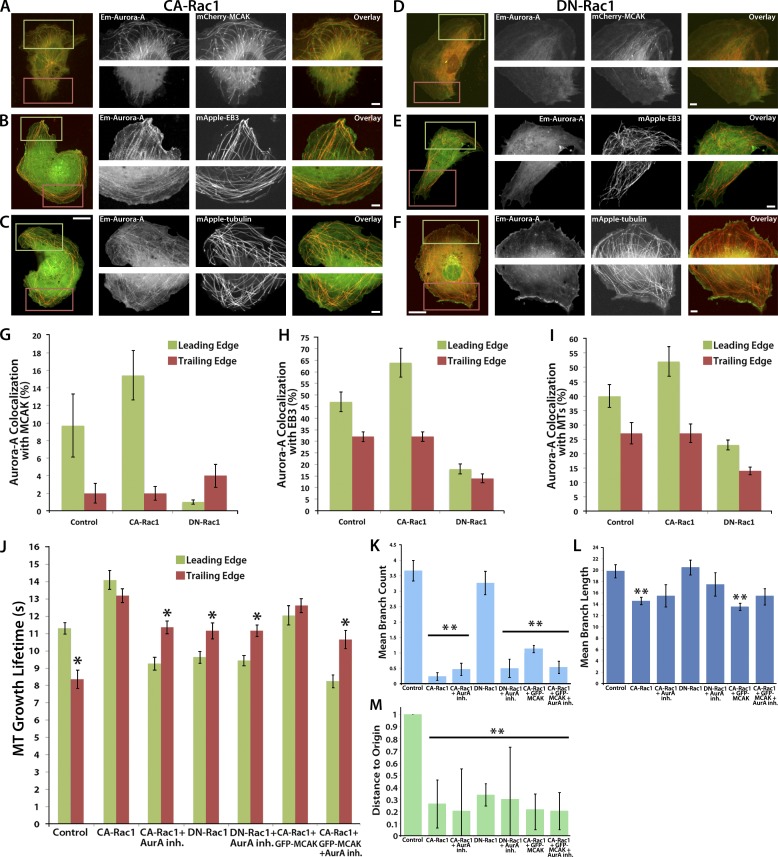
Endothelial cells (ECs) migrate directionally during angiogenesis and wound healing by polarizing to extracellular cues to guide directional movement. EC polarization is controlled by microtubule (MT) growth dynamics, which are regulated by MT-associated proteins (MAPs) that alter MT stability. Mitotic centromere-associated kinesin (MCAK) is a MAP that promotes MT disassembly within the mitotic spindle, yet its function in regulating MT dynamics to promote EC polarity and migration has not been investigated. We used high-resolution fluorescence microscopy coupled with computational image analysis to elucidate the role of MCAK in regulating MT growth dynamics, morphology, and directional migration of ECs. Our results show that MCAK-mediated depolymerization of MTs is specifically targeted to the trailing edge of polarized wound-edge ECs. Regulation of MCAK function is dependent on Aurora A kinase, which is regionally enhanced by signaling from the small guanosine triphosphatase, Rac1. Thus, a Rac1-Aurora A-MCAK signaling pathway mediates EC polarization and directional migration by promoting regional differences in MT dynamics in the leading and trailing cell edges.


Figures

Figure 1.
Figure 1.
MCAK limits MT growth to regulate EC branching morphogenesis and directional migration. (A) A HUVEC at the edge of a monolayer wound overexpressing GFP-MCAK and immunolabeled for α-tubulin displays few MTs compared with untransfected cells. (B and C) A wound-edge HUVEC expressing low levels of GFP-MCAK (green). GFP-MCAK tracks with growing, mApple-EB3–labeled MT plus ends (red) in HUVECs (see also Video 1). (C) Zoom of red-boxed region in B highlights GFP-MCAK and mApple-EB3 colocalization. In A–C, the wound edge faces up. (D) MT tracks shown in E–H are color coded according to their growth speed and lifetime. (E–H), MT growth tracks from 2-min time-lapse videos of mApple-EB3 (2-s intervals) from plusTipTracker software. Whole cells (left) and zoom of boxed regions (right). (E) HUVEC expressing control shRNA. (F) HUVEC expressing shRNA targeting MCAK. (G) HUVEC expressing GFP-MCAK. (H) HUVEC expressing MCAK shRNA and GFP-MCAK (Rescue). (I) Western blot of HUVEC lysates for MCAK in untreated (control) or MCAK shRNA-, GFP-MCAK-, or Rescue-treated HUVECs. (J and K) Comparison of mean MT growth speeds (J) and mean MT growth excursion lifetimes (K) from mApple EB3 tracks for control, MCAK shRNA-, GFP-MCAK–, or Rescue-treated HUVECs. (L) DIC images of HUVECs plated on 0.7 kPa fibronectin-coupled polyacrylamide substrates to induce cell branching. Cells were expressing a fluorescent volume marker (mApple-C1) and either BFP-control shRNA, BFP-MCAK shRNA, GFP-MCAK, or Rescue. (M) Phase-contrast images of BFP-control shRNA, BFP-MCAK shRNA, or GFP-MCAK–expressing HUVECs migrating in an experimentally induced wound. Fluorescence (green) and red arrows point to wound-edge GFP-expressing cells at the start point (left) and end point (right) of the migration assay. (N–P) Quantification of HUVEC branch number per cell (N) and branch length (O). (P) Quantification of directional migration in a wound-edge migration assay. Bars: (A and L) 25 µm; (L, inset) 10 µm; (B–H, main) 10 µm; (B–H, zoomed) 2 µm; (M) 50 µm. *, P < 0.001; **, P < 0.05. Error bars show ± standard error in J and K and ± standard deviation in N–P.
Figure 2.
Figure 2.
MCAK limits MT growth in the trailing edge of migrating cells. (A) Phase-contrast, mApple-EB3, overlay (EB3 shown in green), and schematic depicting the methodology used for defining the leading and trailing edge regions of HUVECs at the edge of a monolayer wound. The line labeled “edge divider” was placed along the edge of the wound to maximize its intersection with distal-most cell–cell junctions as determined from a larger field-of-view image. The edge of the wound faces up. (B) Example of overlays of MT growth tracks from 2-min time-lapse videos of mApple-EB3 (2-s intervals) from plusTipTracker software of tracks for the whole cell and subpopulations of tracks from the leading or trailing edge regions of the cell depicted in A. (C) MT growth tracks in B are color coded according to their growth speed and lifetime. (D and E), Comparison of mean MT growth speeds (D) and mean MT growth excursion lifetimes (E) within the leading and trailing edges of wound-edge HUVECs. Bar, 10 µm. *, P < 0.001. Error bars show ± standard error.
Figure 3.
Figure 3.
Active Aurora A associates with MCAK on MTs. (A–C) Images showing the whole cell (left) and zoomed regions of the leading (green boxes and top right row) and trailing edges (red boxes and bottom right row) of HUVECs at the edge of a monolayer wound expressing Em–Aurora A and either mCherry-MCAK (A), mApple-EB3 (B), or mApple-tubulin (C; see also Video 2). In all panels, the wound edge faces up. (D) Quantification of the fraction of Em–Aurora A that colocalizes with MCAK, EB3, or tubulin under experimental conditions shown in A–C. (E–G) Immunolocalization of pT288–Aurora A and MTs in control (E), Em–Aurora A–expressing (F; inset, Em–Aurora A localization), and wound-edge HUVECs treated with an Aurora A inhibitor (G). Bars: (main) 10 µm; (zoomed) 2 µm; (F, inset) 10 µm. *, P < 0.05. Error bars show ± standard deviation.
Figure 4.
Figure 4.
Aurora A activity is required for association with MCAK but does not affect MCAK localization to growing MT plus ends. (A–C) Images showing the whole cell (left) and zoomed regions of the leading (green boxes and top right row) and trailing edges (red boxes and bottom right row) of HUVECs at the edge of a monolayer wound coexpressing mApple-EB3 and low levels of GFP-MCAK. The wound edge faces up. Fluorescent images reveal MCAK localization to growing MT plus ends in HUVECs in untreated control (A), treated with 40 nM Aurora A inhibitor (B), or overexpressing Aurora A (C). (D) Immunoprecipitation from HUVEC lysates with anti-GFP antibodies in HUVECs in the absence (−) or presence (+) of GFP–Aurora A or GFP-Zyxin expression and Western blot with anti-MCAK (top) or anti-GFP antibodies (bottom). Note that MCAK appears as a doublet in HUVEC lysates, and that the lower molecular mass form exclusively coimmunoprecipitates with Aurora A. (E) Immunoprecipitation with anti-MCAK or anti-GAPDH antibodies from HUVEC cell lysates prepared in the absence (−) or presence (+) of 40 nM Aurora A inhibitor and Western blot with anti–pT288–Aurora A, anti–Aurora A, and anti-MCAK antibodies. Western blot for tubulin shows coprecipitation with GFP–Aurora A (D) and with MCAK (E). IP, immunoprecipitate; TL, total lysate. Bars: (main) 10 µm; (zoomed) 2 µm.
Figure 5.
Figure 5.
Aurora A rescues MCAK overexpression and promotes long-lived MT growth at the leading edge. (A–F) Overlays of MT growth tracks from 2-min time-lapse videos of mApple-EB3 (2-s intervals) from plusTipTracker software in whole cells (left), and zoom of black-boxed regions (right) of HUVECs overexpressing Em–Aurora A in cells treated with 40 nM Aurora A inhibitor, in MCAK knockdown cells treated with Aurora A inhibitor, in cells cooverexpressing mCherry-MCAK and Em–Aurora A, or in shRNA-treated HUVECs rescued with MCAK S196A or S196E mutant constructs. MT tracks are color coded according to their growth speed and lifetime (color scheme in G). (H–L) Comparison of parameters for MT and cell behavior for the treatments of HUVECs described in A–F. Comparison of mean MT growth excursion lifetimes in whole cells (H) and within the leading and trailing edges of wound-edge HUVECs (I). Quantification of branch number (J) and length (K) in HUVECs cultured on fibronectin-coupled 0.7-kPa polyacrylamide substrates to promote branching morphologies. (L) Quantification of directional HUVEC migration in wound-edge migration assay. Bars: (main) 10 µm; (zoomed) 2 µm. *, P < 0.001; **, P < 0.05. Error bars show ± standard error in H and I and ± standard deviation in J–L.
Figure 6.
Figure 6.
Aurora A regulates MT dynamics in response to Rac1 activity. (A–C) Immunolocalization of pT288–Aurora A and MTs in untransfected control HUVECs (A) or HUVECs expressing BFP-tagged CA-Rac1 (B) or DN-Rac1 (C) at the edge of a monolayer wound. The wound edge faces up. (D) Quantification of fluorescence intensity measurements of pT288–Aurora A in wound-edge HUVECs under the conditions described in A–C. (E) Western blot for pT288–Aurora A in lysates of untransfected control HUVECs (control) or HUVECs expressing CA-Rac1 or DN-Rac1. Lysates were also probed for total Aurora A, and GAPDH is shown as a loading control. (F) Comparison of mean MT growth lifetimes measured from 2-min time-lapse videos of mApple-EB3 using plusTipTracker software in HUVECs expressing mApple-EB3 (control) or HUVECs coexpressing mApple-EB3 and CA-Rac1 or DN-Rac1 in the presence or absence of 40 nM Aurora A inhibitor, or coexpressing mApple-EB3 and CA-Rac1 or DN-Rac1 and GFP-MCAK in the presence or absence of 40 nM Aurora A inhibitor. (G–M) MTs are color coded according to their growth speed and lifetime (color scheme in G). (H–M) MT growth tracks from 2-min time-lapse videos of mApple-EB3 (2-s intervals) overlaid on images of whole HUVECs (left) and zoom of black-boxed regions (right) of HUVECs, treated as described. Bars: (main) 10 µm; (zoomed) 2 µm. *, P < 0.001; **, P < 0.05. Error bars show ± standard error in F and ± standard deviation in D.
Figure 7.
Figure 7.
Rac1 promotes long-lived leading edge MT growth excursions in an Aurora A– and MCAK-dependent manner. (A–F) Images showing the whole cell (left) and zoomed regions of the leading (green boxes and top right row) and trailing (red boxes and bottom right row) edges of HUVECs at the edge of a monolayer wound that were coexpressing either CA-Rac1 (A–C) or DN-Rac1 (D–F) together with Em–Aurora A and either mCherry-MCAK (A and D), mApple-EB3 (B and E), or mApple-tubulin (C and F; see also Videos 3 and 4). The wound edge faces up. (G–I) Quantification and comparison of the fraction of Em–Aurora A that colocalized with MCAK (G), EB3 (H), or tubulin (I) in control, CA-Rac1, or DN-Rac1–expressing HUVECs. (J) Comparison of mean MT growth lifetimes measured from 2-min time-lapse videos of mApple-EB3 using plusTipTracker software in the leading and trailing edges of wound-edge HUVECs expressing mApple-EB3 (control) or HUVECs coexpressing mApple-EB3 and CA-Rac1 or DN-Rac1 in the presence or absence of 40 nM Aurora A inhibitor, or coexpressing mApple-EB3 and CA-Rac1 or DN-Rac1 and GFP-MCAK in the presence or absence of 40 nM Aurora A inhibitor. Quantification of branch number (K) and length (L) in HUVECs cultured on fibronectin-coupled 0.7-kPa polyacrylamide substrates to promote branching morphologies. (M) Quantification of directional HUVEC migration in wound-edge migration assay. Bars: (main) 10 µm; (zoomed) 2 µm. *, P < 0.001; **, P < 0.05. Error bars show ± standard deviation in G–I and K–M and ± standard error in J.

Similar articles

Cited by

References

    1. Ahmad, F.J., Pienkowski T.P., and Baas P.W.. 1993. Regional differences in microtubule dynamics in the axon. J. Neurosci. 13:856–866 - PMC - PubMed
    1. Akhmanova, A., Hoogenraad C.C., Drabek K., Stepanova T., Dortland B., Verkerk T., Vermeulen W., Burgering B.M., De Zeeuw C.I., Grosveld F., and Galjart N.. 2001. Clasps are CLIP-115 and -170 associating proteins involved in the regional regulation of microtubule dynamics in motile fibroblasts. Cell. 104:923–935 10.1016/S0092-8674(01)00288-4 - DOI - PubMed
    1. Al-Bassam, J., and Chang F.. 2011. Regulation of microtubule dynamics by TOG-domain proteins XMAP215/Dis1 and CLASP. Trends Cell Biol. 21:604–614 10.1016/j.tcb.2011.06.007 - DOI - PMC - PubMed
    1. Andrews, P.D., Ovechkina Y., Morrice N., Wagenbach M., Duncan K., Wordeman L., and Swedlow J.R.. 2004. Aurora B regulates MCAK at the mitotic centromere. Dev. Cell. 6:253–268 10.1016/S1534-5807(04)00025-5 - DOI - PubMed
    1. Applegate, K.T., Besson S., Matov A., Bagonis M.H., Jaqaman K., and Danuser G.. 2011. plusTipTracker: Quantitative image analysis software for the measurement of microtubule dynamics. J. Struct. Biol. 176:168–184 10.1016/j.jsb.2011.07.009 - DOI - PMC - PubMed

Publication types

MeSH terms