Floral trait variation and integration as a function of sexual deception in Gorteria diffusa
- PMID: 25002705
- PMCID: PMC4084545
- DOI: 10.1098/rstb.2013.0563
Floral trait variation and integration as a function of sexual deception in Gorteria diffusa
Abstract
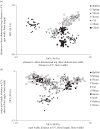
Phenotypic integration, the coordinated covariance of suites of morphological traits, is critical for proper functioning of organisms. Angiosperm flowers are complex structures comprising suites of traits that function together to achieve effective pollen transfer. Floral integration could reflect shared genetic and developmental control of these traits, or could arise through pollinator-imposed stabilizing correlational selection on traits. We sought to expose mechanisms underlying floral trait integration in the sexually deceptive daisy, Gorteria diffusa, by testing the hypothesis that stabilizing selection imposed by male pollinators on floral traits involved in mimicry has resulted in tighter integration. To do this, we quantified patterns of floral trait variance and covariance in morphologically divergent G. diffusa floral forms representing a continuum in the levels of sexual deception. We show that integration of traits functioning in visual attraction of male pollinators increases with pollinator deception, and is stronger than integration of non-mimicry trait modules. Consistent patterns of within-population trait variance and covariance across floral forms suggest that integration has not been built by stabilizing correlational selection on genetically independent traits. Instead pollinator specialization has selected for tightened integration within modules of linked traits. Despite potentially strong constraint on morphological evolution imposed by developmental genetic linkages between traits, we demonstrate substantial divergence in traits across G. diffusa floral forms and show that divergence has often occurred without altering within-population patterns of trait correlations.
Keywords: Gorteria; insect mimicry; integration.
© 2014 The Author(s) Published by the Royal Society. All rights reserved.
Figures


Similar articles
-
The influence of pollinator phylogeography and mate preference on floral divergence in a sexually deceptive daisy.Evolution. 2013 Jun;67(6):1706-14. doi: 10.1111/evo.12070. Epub 2013 Feb 28. Evolution. 2013. PMID: 23730763
-
Floral mimicry enhances pollen export: the evolution of pollination by sexual deceit outside of the orchidaceae.Am Nat. 2010 Nov;176(5):E143-51. doi: 10.1086/656487. Am Nat. 2010. PMID: 20843263
-
Multiple gene co-options underlie the rapid evolution of sexually deceptive flowers in Gorteria diffusa.Curr Biol. 2023 Apr 24;33(8):1502-1512.e8. doi: 10.1016/j.cub.2023.03.003. Epub 2023 Mar 23. Curr Biol. 2023. PMID: 36963385
-
Orchid pollination by sexual deception: pollinator perspectives.Biol Rev Camb Philos Soc. 2011 Feb;86(1):33-75. doi: 10.1111/j.1469-185X.2010.00134.x. Biol Rev Camb Philos Soc. 2011. PMID: 20377574 Review.
-
On the success of a swindle: pollination by deception in orchids.Naturwissenschaften. 2005 Jun;92(6):255-64. doi: 10.1007/s00114-005-0636-y. Naturwissenschaften. 2005. PMID: 15931514 Review.
Cited by
-
Experimental examination of pollinator-mediated selection in a sexually deceptive orchid.Ann Bot. 2019 Jan 23;123(2):347-354. doi: 10.1093/aob/mcy083. Ann Bot. 2019. PMID: 29878057 Free PMC article.
-
Mapping Floral Genetic Architecture in Prunus mume, an Ornamental Woody Plant.Front Plant Sci. 2022 Feb 8;13:828579. doi: 10.3389/fpls.2022.828579. eCollection 2022. Front Plant Sci. 2022. PMID: 35211141 Free PMC article.
-
Vividly coloured poppy flowers due to dense pigmentation and strong scattering in thin petals.J Comp Physiol A Neuroethol Sens Neural Behav Physiol. 2019 Jun;205(3):363-372. doi: 10.1007/s00359-018-01313-1. Epub 2019 Jan 28. J Comp Physiol A Neuroethol Sens Neural Behav Physiol. 2019. PMID: 30689019 Free PMC article.
-
Pollinator-mediated selection on floral size and tube color in Linum pubescens: Can differential behavior and preference in different times of the day maintain dimorphism?Ecol Evol. 2017 Dec 20;8(2):1096-1106. doi: 10.1002/ece3.3683. eCollection 2018 Jan. Ecol Evol. 2017. PMID: 29375782 Free PMC article.
-
The role of pollinators in the evolution of corolla shape variation, disparity and integration in a highly diversified plant family with a conserved floral bauplan.Ann Bot. 2016 Apr;117(5):889-904. doi: 10.1093/aob/mcv194. Epub 2016 Feb 15. Ann Bot. 2016. PMID: 26884512 Free PMC article.
References
-
- Olson EC, Miller RL. 1958. Morphological integration. Chicago, IL: University of Chicago Press.
-
- Pigliucci M, Preston K. 2004. Phenotypic integration: studying the ecology and evolution of complex phenotypes. New York, NY: Oxford University Press.
-
- Stebbins GL. 1950. Variation and evolution in plants. New York, NY: Columbia University Press.
Publication types
MeSH terms
LinkOut - more resources
Full Text Sources
Other Literature Sources

