

Do muscle synergies reduce the dimensionality of behavior?
- PMID: 25002844
- PMCID: PMC4066703
- DOI: 10.3389/fncom.2014.00063
Do muscle synergies reduce the dimensionality of behavior?
Abstract
The muscle synergy hypothesis is an archetype of the notion of Dimensionality Reduction (DR) occurring in the central nervous system due to modular organization. Toward validating this hypothesis, it is important to understand if muscle synergies can reduce the state-space dimensionality while maintaining task control. In this paper we present a scheme for investigating this reduction utilizing the temporal muscle synergy formulation. Our approach is based on the observation that constraining the control input to a weighted combination of temporal muscle synergies also constrains the dynamic behavior of a system in a trajectory-specific manner. We compute this constrained reformulation of system dynamics and then use the method of system balancing for quantifying the DR; we term this approach as Trajectory Specific Dimensionality Analysis (TSDA). We then investigate the consequence of minimization of the dimensionality for a given task. These methods are tested in simulations on a linear (tethered mass) and a non-linear (compliant kinematic chain) system. Dimensionality of various reaching trajectories is compared when using idealized temporal synergies. We show that as a consequence of this Minimum Dimensional Control (MDC) model, smooth straight-line Cartesian trajectories with bell-shaped velocity profiles emerged as the optima for the reaching task. We also investigated the effect on dimensionality due to adding via-points to a trajectory. The results indicate that a trajectory and synergy basis specific DR of behavior results from muscle synergy control. The implications of these results for the synergy hypothesis, optimal motor control, motor development, and robotics are discussed.
Keywords: Hankel singular values; dimensionality reduction; modular motor control; muscle synergies; optimal motor control; system balancing.
Figures
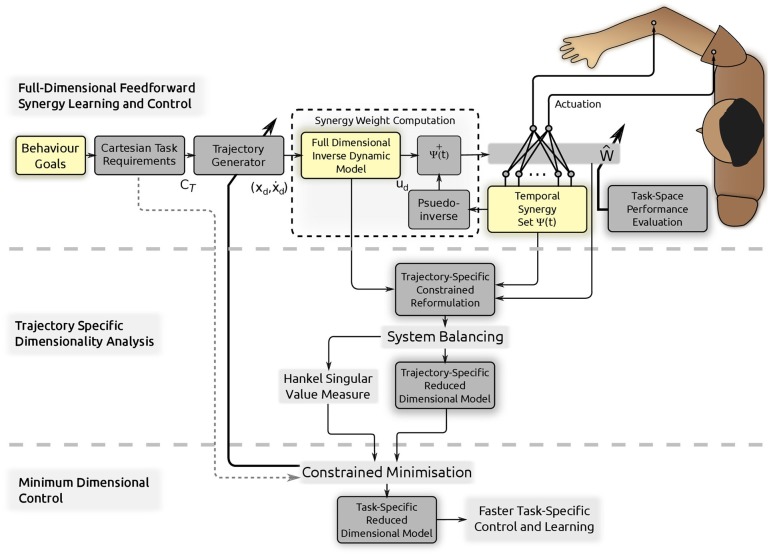
 obtained from behavior goals into the necessary synergy weight matrix Ŵ. A trajectory (and synergy basis) specific constrained reformulation is then obtained and the procedure of system balancing is used to reduce the dimensionality: the proposed Trajectory Specific Dimensionality Analysis (TSDA). The Hankel Singular Value measure computed through system balancing is developed into a performance index for minimization in the Minimum Dimensional Control (MDC) model. The resulting reduced dimensional model can instead be used within the synergy control learning in the control and learning scheme (on top) to speed up learning and adaptation in a task-specific manner.
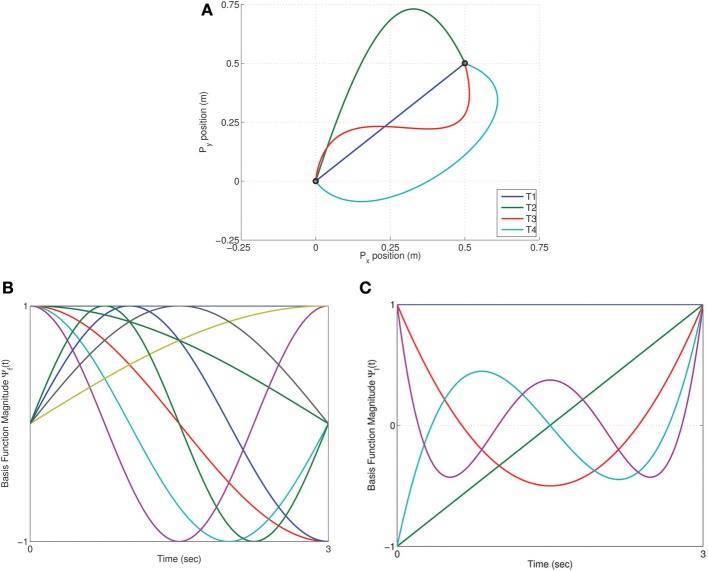
 fourier = [1, 3, 2, 3], and legendre = [1, 3, 3, 3]. The straight line trajectory has the minimum dimensionality for both of these synergy bases.
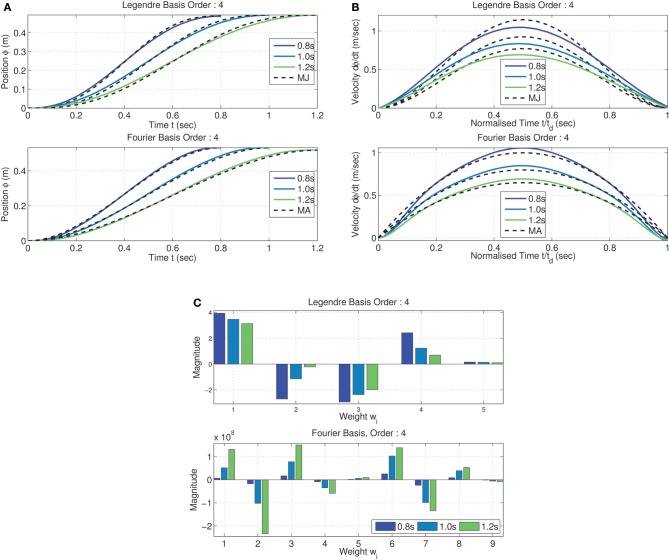
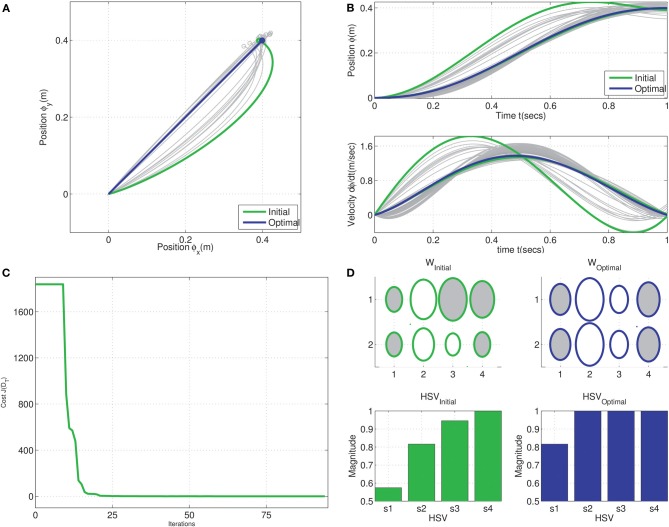
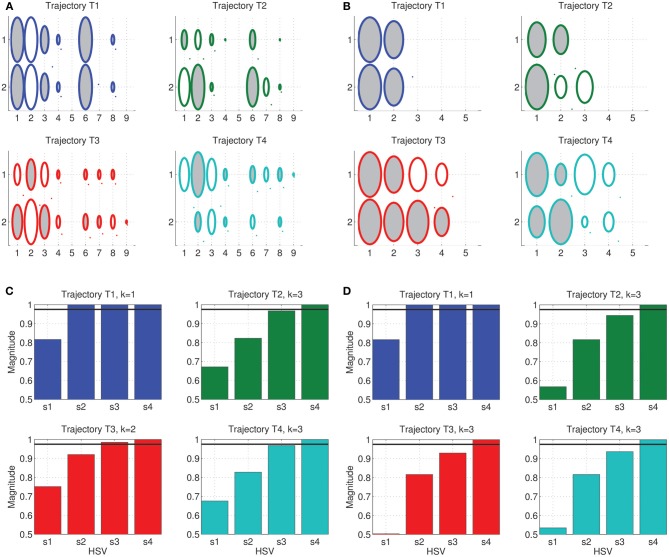
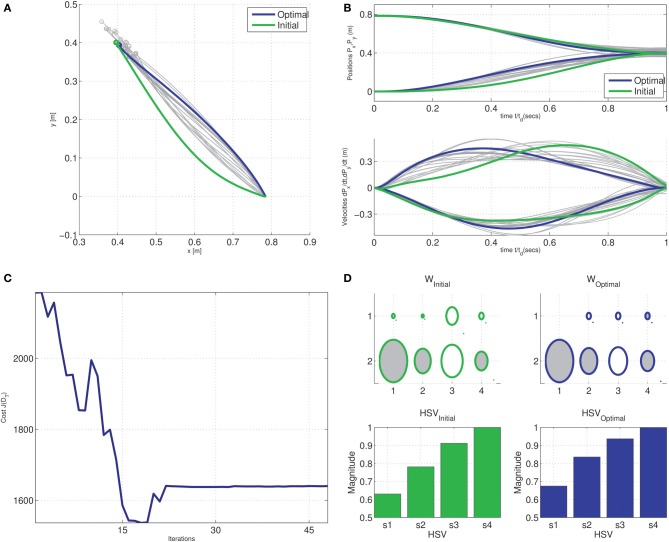
 T) cost with each iteration of optimization, and (D) Hinton diagram of the initial and optimal weights and the corresponding normalized Hankel singular values.
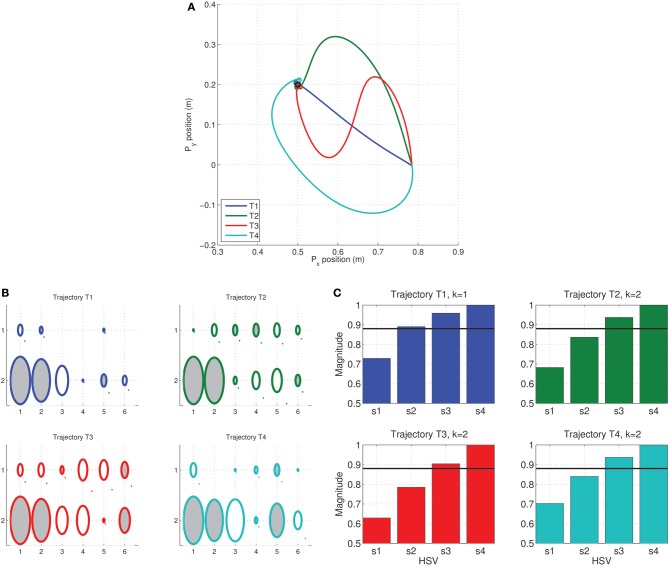 = [1, 2, 2, 2]. The straight line trajectory T1 has minimum dimensionality as measured by the HSV magnitudes.
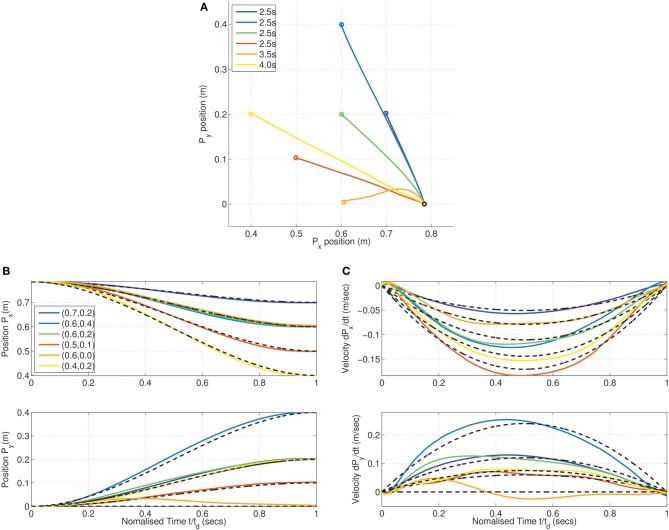
 T) cost with each iteration of optimization, and (D) Hinton diagram of the initial and optimal weights and the corresponding normalized Hankel singular values.
Similar articles
-
Muscle synergies in neuroscience and robotics: from input-space to task-space perspectives.Front Comput Neurosci. 2013 Apr 19;7:43. doi: 10.3389/fncom.2013.00043. eCollection 2013. Front Comput Neurosci. 2013. PMID: 23626535 Free PMC article.
-
Extracting motor synergies from random movements for low-dimensional task-space control of musculoskeletal robots.Bioinspir Biomim. 2015 Oct 8;10(5):056016. doi: 10.1088/1748-3190/10/5/056016. Bioinspir Biomim. 2015. PMID: 26448530
-
A computational analysis of motor synergies by dynamic response decomposition.Front Comput Neurosci. 2014 Jan 16;7:191. doi: 10.3389/fncom.2013.00191. eCollection 2013. Front Comput Neurosci. 2014. PMID: 24474915 Free PMC article.
-
Feasibility of Muscle Synergy Outcomes in Clinics, Robotics, and Sports: A Systematic Review.Appl Bionics Biomech. 2018 Apr 1;2018:3934698. doi: 10.1155/2018/3934698. eCollection 2018. Appl Bionics Biomech. 2018. PMID: 29808098 Free PMC article. Review.
-
Neuromuscular synergies in motor control in normal and poststroke individuals.Rev Neurosci. 2018 Aug 28;29(6):593-612. doi: 10.1515/revneuro-2017-0058. Rev Neurosci. 2018. PMID: 29397390 Review.
Cited by
-
Afferents to Action: Cortical Proprioceptive Processing Assessed with Corticokinematic Coherence Specifically Relates to Gross Motor Skills.eNeuro. 2024 Jan 29;11(1):ENEURO.0384-23.2023. doi: 10.1523/ENEURO.0384-23.2023. Print 2024 Jan. eNeuro. 2024. PMID: 38164580 Free PMC article.
-
Editorial: Modularity in motor control: from muscle synergies to cognitive action representation.Front Comput Neurosci. 2015 Oct 9;9:126. doi: 10.3389/fncom.2015.00126. eCollection 2015. Front Comput Neurosci. 2015. PMID: 26500533 Free PMC article. No abstract available.
-
Motor primitives--new data and future questions.Curr Opin Neurobiol. 2015 Aug;33:156-65. doi: 10.1016/j.conb.2015.04.004. Epub 2015 Apr 22. Curr Opin Neurobiol. 2015. PMID: 25912883 Free PMC article. Review.
-
Clarifying the Biomechanical Concept of Coordination Through Comparison With Coordination in Motor Control.Front Sports Act Living. 2021 Oct 14;3:753062. doi: 10.3389/fspor.2021.753062. eCollection 2021. Front Sports Act Living. 2021. PMID: 34723181 Free PMC article. Review.
-
A theory of brain-computer interface learning via low-dimensional control.bioRxiv [Preprint]. 2025 Jan 26:2024.04.18.589952. doi: 10.1101/2024.04.18.589952. bioRxiv. 2025. PMID: 38712193 Free PMC article. Preprint.
References
-
- Alessandro C., Carbajal J. P., Avella A. (2012). Synthesis and adaptation of effective motor synergies for the solution of reaching tasks, in From Animals to Animats 12, 12th International Conference on Simulation of Adaptive Behavior, SAB 2012, Proceedings, Vol. 7426, 33–43 (Berlin, Heidelberg: Springer; ).
-
- Antoulas A., Sorensen D., Gugercin S. (2001). A survey of model reduction methods for large-scale systems. Contemp. Math. 280, 193–219 10.1090/conm/280/04630 - DOI
-
- Bellman R. (1961). Adaptive Control Processes: A Guided Tour. Princeton, NJ: Princeton University Press
LinkOut - more resources
Full Text Sources
Other Literature Sources