

African Dust Storms Reaching Puerto Rican Coast Stimulate the Secretion of IL-6 and IL-8 and Cause Cytotoxicity to Human Bronchial Epithelial Cells (BEAS-2B)
- PMID: 25002916
- PMCID: PMC4082624
- DOI: 10.4236/health.2013.510A2003
African Dust Storms Reaching Puerto Rican Coast Stimulate the Secretion of IL-6 and IL-8 and Cause Cytotoxicity to Human Bronchial Epithelial Cells (BEAS-2B)
Abstract
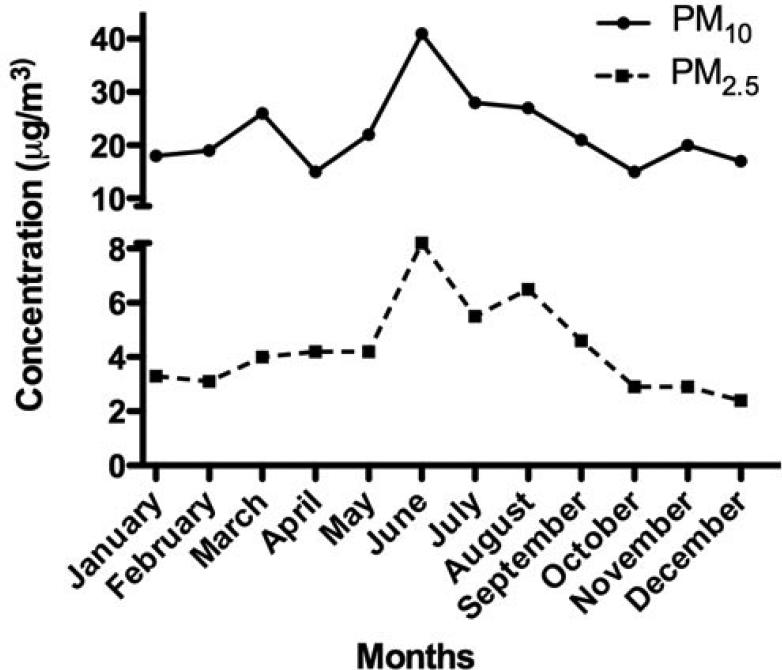
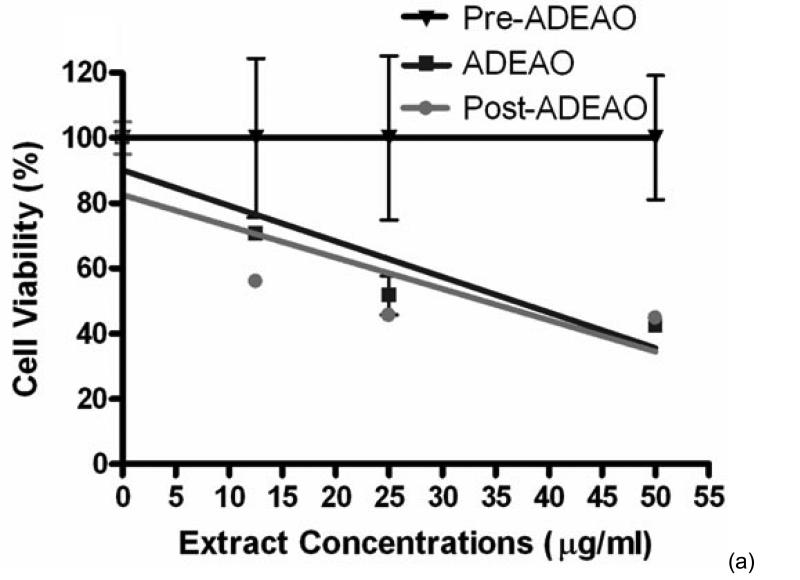
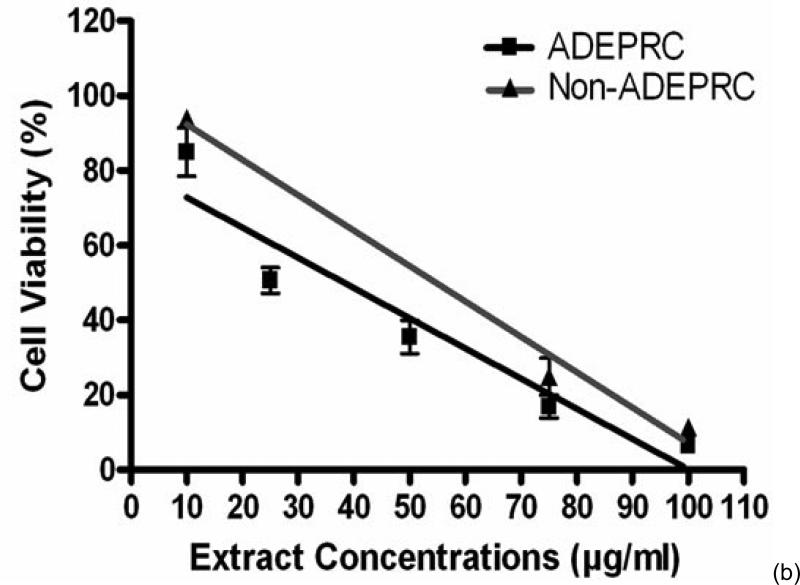
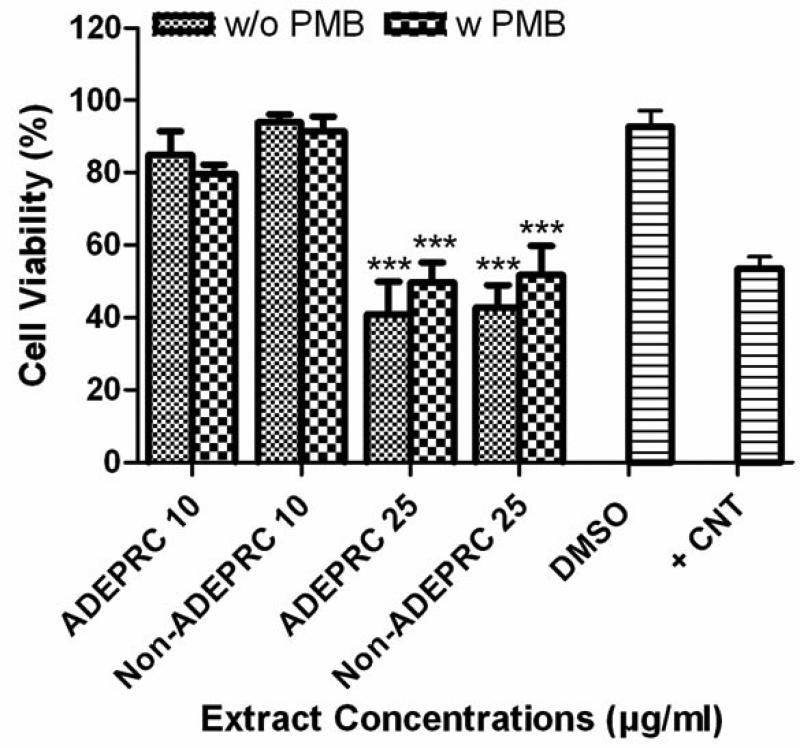
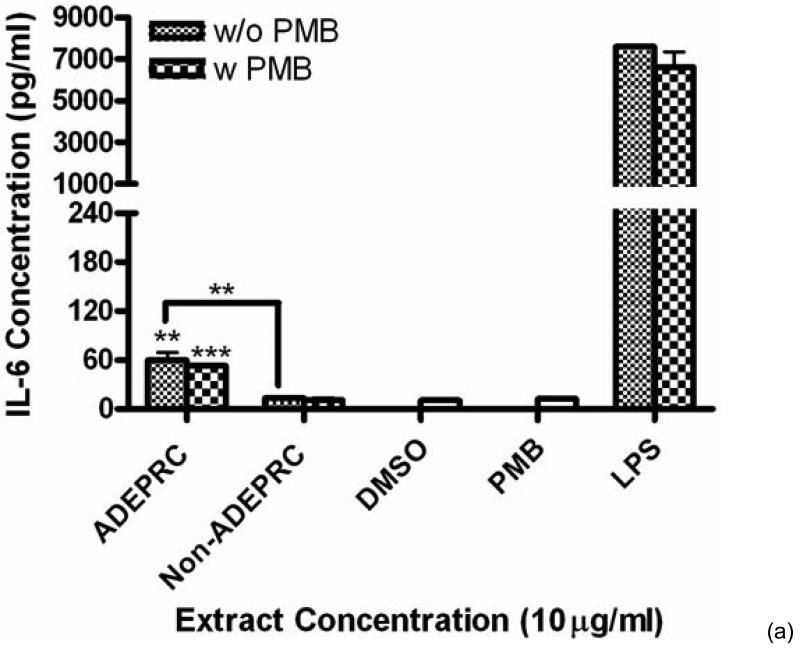
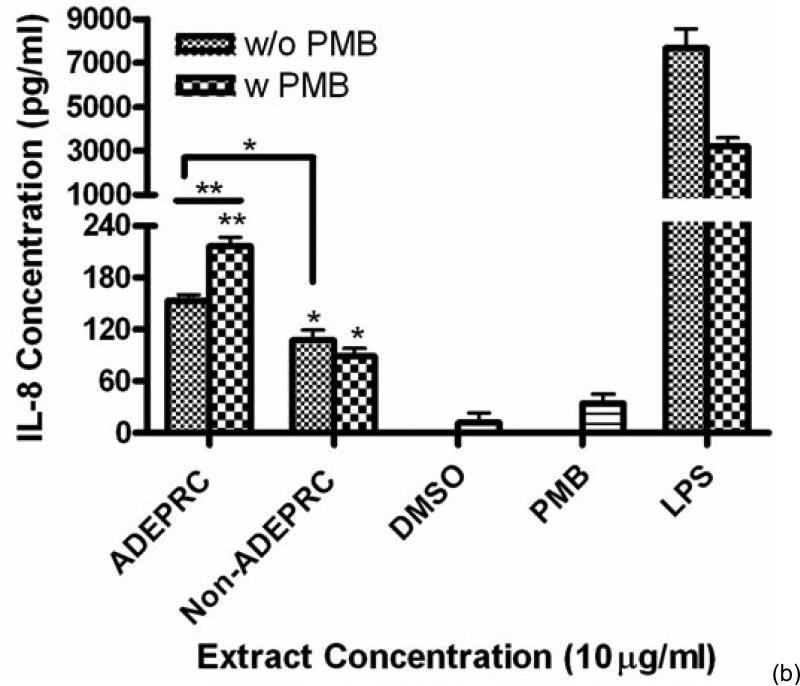
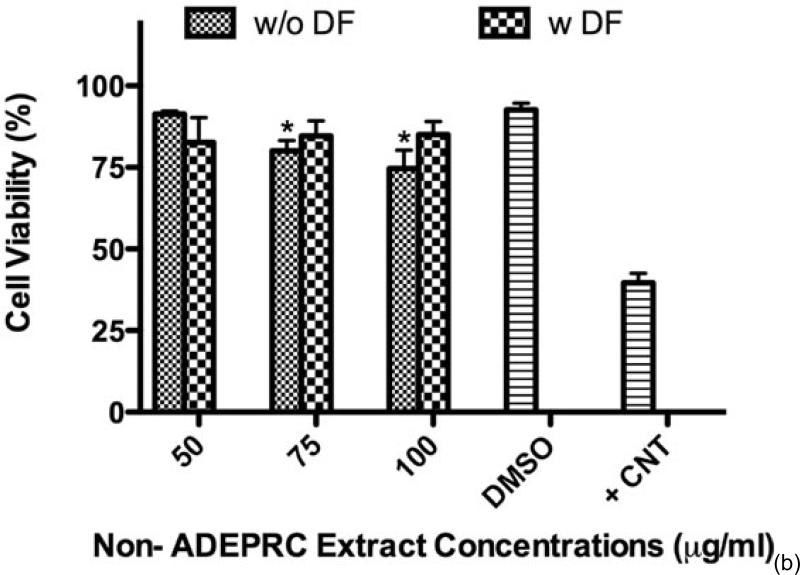
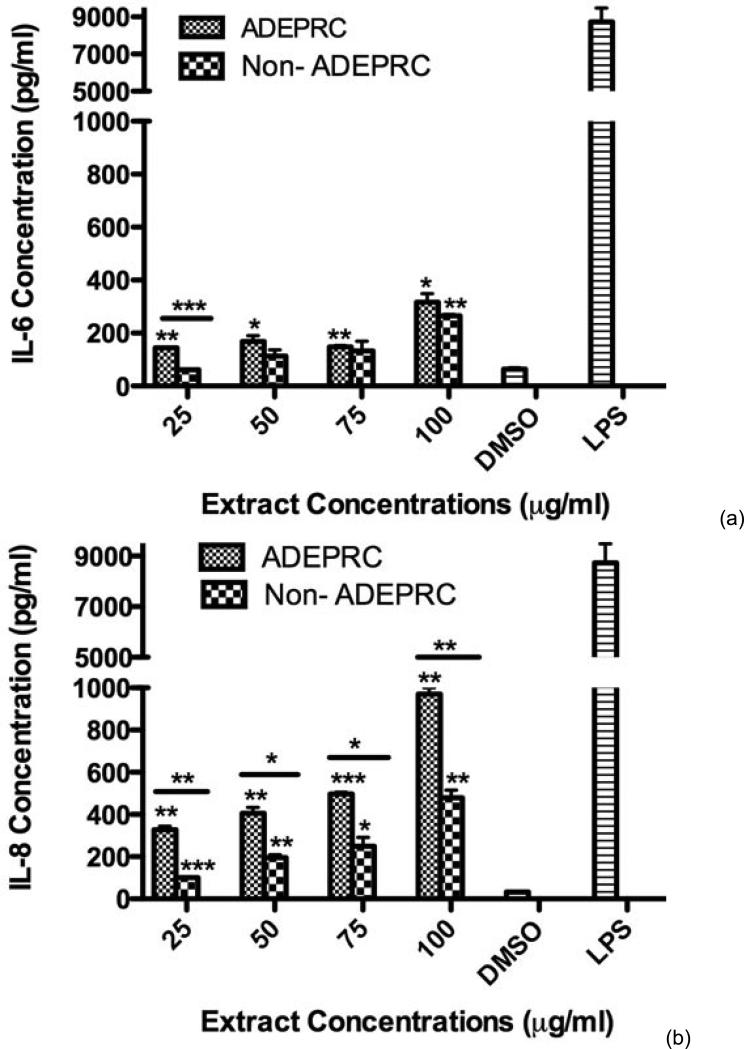
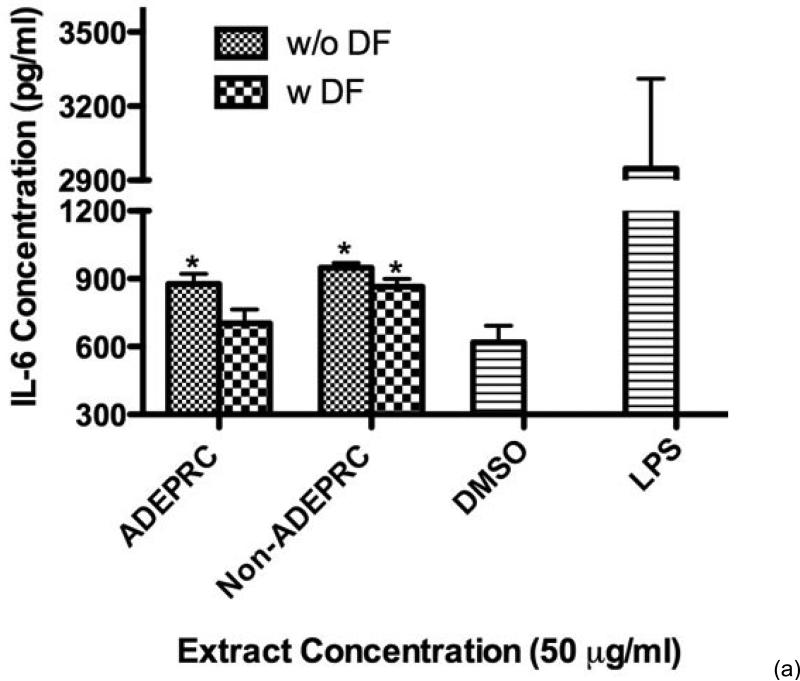
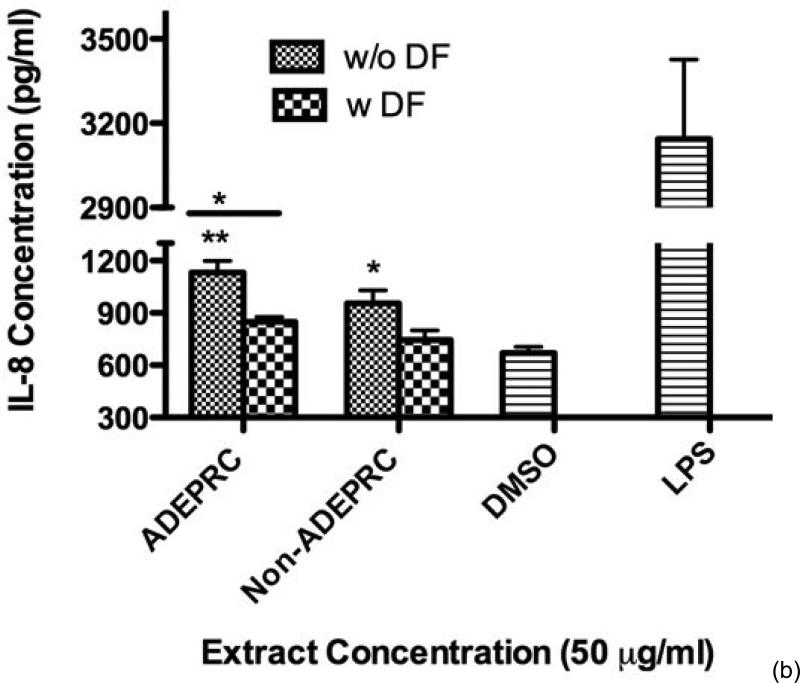
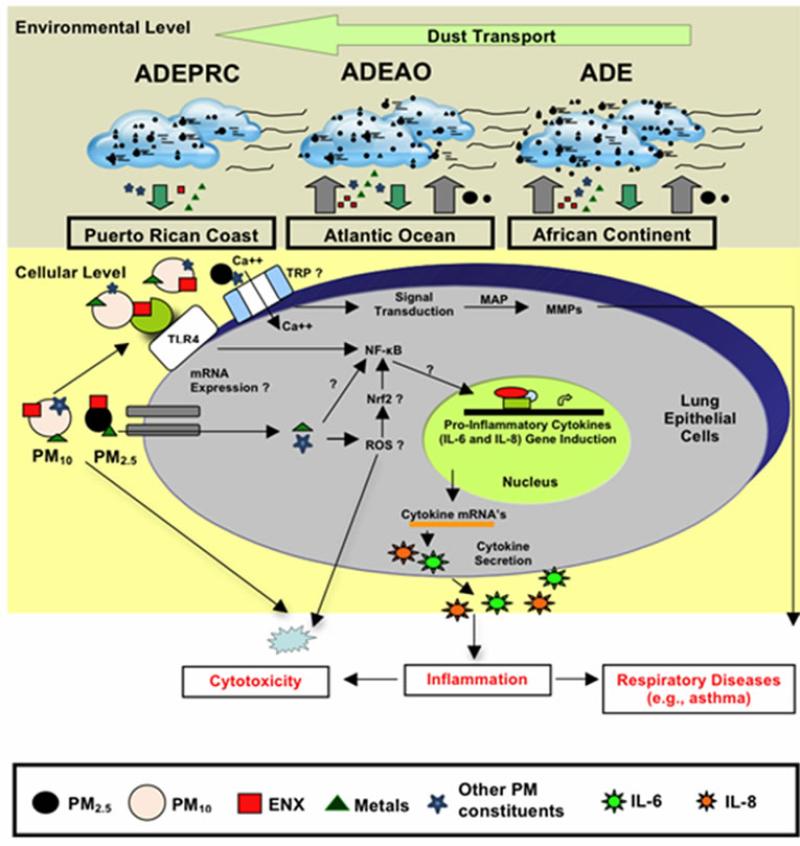
African dust storm events (ADE) travel across the Atlantic Ocean (ADEAO) and reach the Puerto Rican coast (ADEPRC), potentially impacting air quality and human health. To what extent seasonal variations in atmospheric particulate matter (PM) size fractions, composition and sources trigger respiratory-adverse effects to Puerto Ricans is still unclear. In the present study, we investigated the pro-inflammatory and cytotoxic effects of PM samples harvested during ADEAO (PM10), ADEPRC (PM2.5 and PM10) and Non-ADE (Preand Post-ADEAO and Non-ADEPRC), using BEAS-2B cells. Endotoxins (ENX) in PM2.5 and PM10 extracts and traces of metals (TMET) in PM2.5 extracts were also examined. IL-6 and IL-8 secretion and cytotoxicity were used as endpoints. ADEAO and ADEPRC extracts were found to be more cytotoxic than Non-ADE and ADEAO were more toxic than ADEPRC extracts. PM10 extracts from ADEAO and Post-ADEAO caused significant secretion of IL-8. IL-6 and IL-8 secretion was higher following treatment with PM10 and PM2.5 ADEPRC than with Non-ADEPRC extracts. ENX levels were found to be higher in PM10 ADEAO than in the rest of the samples tested. TMET levels were higher in PM2.5 ADEPRC than in Non-ADEPRC extracts. Deferoxamine significantly reduced cytotoxicity and IL-6 and IL-8 secretion whereas Polymyxin B did not. TMET in PM2.5 fractions is a major determinant in ADEPRC-induced toxicity and work in conjunction with ENX to cause toxicity to lung cells in vitro. ENX and TMET may be responsible, in part, for triggering PM-respiratory adverse responses in susceptible and predisposed individuals.
Keywords: BEAS-2B cells; dust storm; endotoxins; metals; particulate matter.
Figures


Similar articles
-
Linking Endotoxins, African Dust PM10 and Asthma in an Urban and Rural Environment of Puerto Rico.Mediators Inflamm. 2015;2015:784212. doi: 10.1155/2015/784212. Epub 2015 Nov 22. Mediators Inflamm. 2015. PMID: 26681839 Free PMC article.
-
Identification of PM10 characteristics involved in cellular responses in human bronchial epithelial cells (Beas-2B).Environ Res. 2016 Aug;149:48-56. doi: 10.1016/j.envres.2016.04.029. Epub 2016 May 10. Environ Res. 2016. PMID: 27177354
-
Temporal-spatial variations of the physicochemical characteristics of air pollution Particulate Matter (PM2.5-0.3) and toxicological effects in human bronchial epithelial cells (BEAS-2B).Environ Res. 2015 Feb;137:256-67. doi: 10.1016/j.envres.2014.12.015. Epub 2015 Jan 16. Environ Res. 2015. PMID: 25601727
-
Organic extracts from African dust storms stimulate oxidative stress and induce inflammatory responses in human lung cells through Nrf2 but not NF-κB.Environ Toxicol Pharmacol. 2015 Mar;39(2):845-56. doi: 10.1016/j.etap.2015.02.015. Epub 2015 Feb 26. Environ Toxicol Pharmacol. 2015. PMID: 25769104 Free PMC article.
-
Particle characteristics responsible for effects on human lung epithelial cells.Res Rep Health Eff Inst. 2002 Dec;(110):1-65; discussion 67-76. Res Rep Health Eff Inst. 2002. PMID: 12578113 Review.
Cited by
-
Particle pollution in Rio de Janeiro, Brazil: increase and decrease of pro-inflammatory cytokines IL-6 and IL-8 in human lung cells.Environ Pollut. 2014 Nov;194:112-120. doi: 10.1016/j.envpol.2014.07.010. Epub 2014 Aug 6. Environ Pollut. 2014. PMID: 25106047 Free PMC article.
-
Exposure to respirable desert dust entering indoors prompts quick oxidative-stress and inflammatory responses in the airways of chronic heart failure patients.Sci Rep. 2025 Aug 3;15(1):28318. doi: 10.1038/s41598-025-14289-1. Sci Rep. 2025. PMID: 40754565 Free PMC article.
-
Selective ATP-Binding Cassette Subfamily C Gene Expression and Proinflammatory Mediators Released by BEAS-2B after PM2.5, Budesonide, and Cotreated Exposures.Mediators Inflamm. 2017;2017:6827194. doi: 10.1155/2017/6827194. Epub 2017 Aug 16. Mediators Inflamm. 2017. PMID: 28900313 Free PMC article.
-
Urban Lifestyle and Climate-Driven Environmental Exposures: Immunological Consequences for Pediatric Respiratory Allergies.Immun Inflamm Dis. 2025 Aug;13(8):e70248. doi: 10.1002/iid3.70248. Immun Inflamm Dis. 2025. PMID: 40801216 Free PMC article. Review.
-
Characterizing environmental asthma triggers and healthcare use patterns in Puerto Rico.J Asthma. 2020 Aug;57(8):886-897. doi: 10.1080/02770903.2019.1612907. Epub 2019 Jun 12. J Asthma. 2020. PMID: 31187658 Free PMC article.
References
-
- Prospero JM, Nees RT. Dust concentration in the atmosphere of the equatorial north Atlantic: Possible relationship to the Sahelian drought. Science. 1977;196:1196–1198. http://dx.doi.org/10.1126/science.196.4295.1196. - DOI - PubMed
-
- Wittig R, König K, Schmidt M, Szarzynski J. A study of climate change and anthropogenic impacts in West Africa. Environmental Science and Pollution Research. 2007;14:182–189. http://dx.doi.org/10.1065/espr2007.02.388. - DOI - PubMed
-
- Griffin DW. Atmospheric movement of microorganisms in clouds of desert dust and implications for human health. Clinical Microbiology Reviews. 2007;20:459–477. http://dx.doi.org/10.1128/CMR.00039-06. - DOI - PMC - PubMed
-
- Prospero JM, Lamb PJ. African droughts and dust transport to the Caribbean: Climate change implications. Science. 2003;302:1024–1027. http://dx.doi.org/10.1126/science.1089915. - DOI - PubMed
-
- Griffin DW, Seba DB. Atmospheric transport of mold spores in clouds of desert dust. Archives of Environmental Health. 2003;58:498–504. - PubMed
Grants and funding
LinkOut - more resources
Full Text Sources
Other Literature Sources