

Prevalence and Trends of Adult Obesity in the US, 1999-2012
- PMID: 25002986
- PMCID: PMC3913362
- DOI: 10.1155/2014/185132
Prevalence and Trends of Adult Obesity in the US, 1999-2012
Abstract
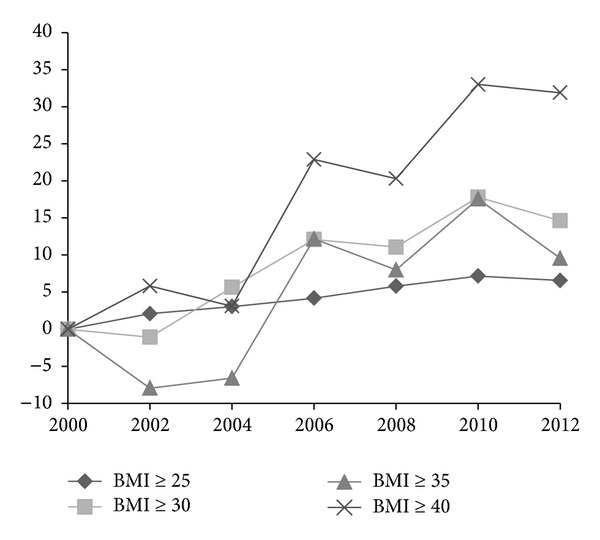
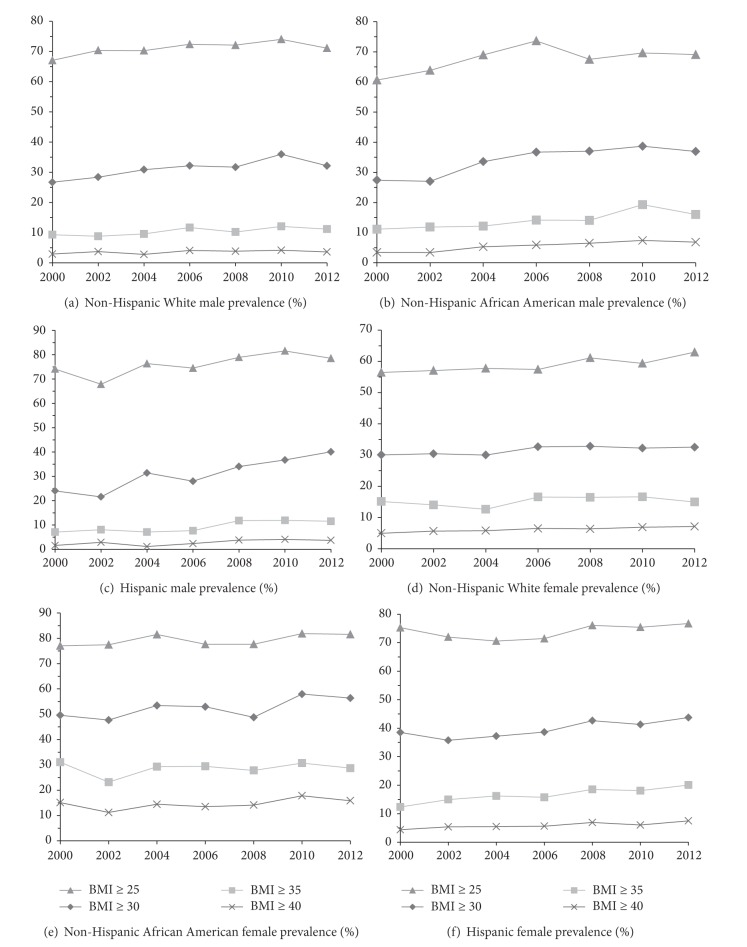
Aim. To provide national estimates of obesity among US adults aged 20 years and older in 2011-2012 and track its trends from 1999 to 2012. Methods. Measured weight/height from National Health and Nutrition Examination Survey 1999-2012 waves was used to calculate body mass index (BMI) and prevalence measures. Piecewise logistic regressions were conducted to test the differential trends before and after 2010. Results. In 2011-2012, the age-adjusted prevalence of overweight and obesity combined (BMI ≥ 25) was 71.1% (95% CI: 68.0%-74.2%) among men and 65.5% (61.8%-69.3%) among women, and the prevalence of obesity (BMI ≥ 30) was 33.3% (30.5%-36.2%) among men and 35.8% (32.3%-39.4%) among women. From 1990-2000 to 2009-2010, the prevalence of overweight and obesity combined, obesity, grades 2 and 3 obesity combined (BMI ≥ 35), and grade 3 obesity (BMI ≥ 40) increased by 7.2%, 17.8%, 17.6%, and 33.0%, respectively. Compared to 2009-2010, most gender- and race/ethnicity-specific prevalence measures remained unchanged or slightly decreased in 2011-2012. No significant difference in trends among prevalence measures was found before and after 2010. Conclusions. Concurrent evidence on the leveling off of obesity in the US is thin. Given its high prevalence and profound socioeconomic consequences, close monitoring of the trend is warranted.
Figures
References
-
- NIH, NHLBI Obesity Education Initiative. Clinical Guidelines on the Identification, Evaluation, and Treatment of Overweight and Obesity in Adults, the Evidence Report. October 2013, http://www.nhlbi.nih.gov/guidelines/obesity/ob_gdlns.pdf.
-
- Fryar CD, Carroll MD, Ogden CL. Prevalence of overweight, obesity, and extreme obesity among adults: United States, trends 1960–1962 through 2009-2010. October 2013, http://www.cdc.gov/nchs/products/hestats.htm.
-
- OECD. OECD Obesity Update 2012. October 2013, http://www.oecd.org/health/health-systems/theeconomicsofprevention.htm.
-
- Finkelstein EA, Trogdon JG, Cohen JW, Dietz W. Annual medical spending attributable to obesity: payer-and service-specific estimates. Health Affairs. 2009;28(5):w822–w831. - PubMed
LinkOut - more resources
Full Text Sources
Other Literature Sources