. 2014 Jun 16:5:77-83.
doi: 10.1016/j.nicl.2014.06.005. eCollection 2014.

Head model and electrical source imaging: a study of 38 epileptic patients

Affiliations

Head model and electrical source imaging: a study of 38 epileptic patients

Gwénael Birot et al. Neuroimage Clin. .

Abstract

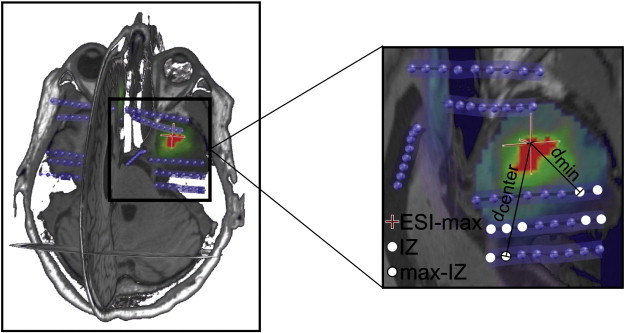
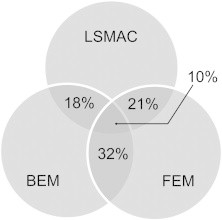
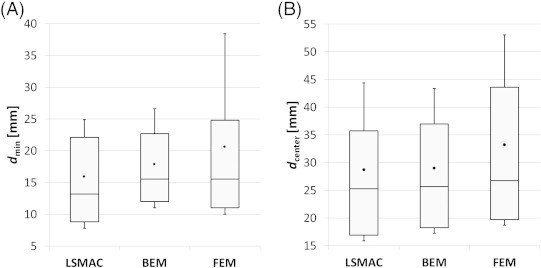
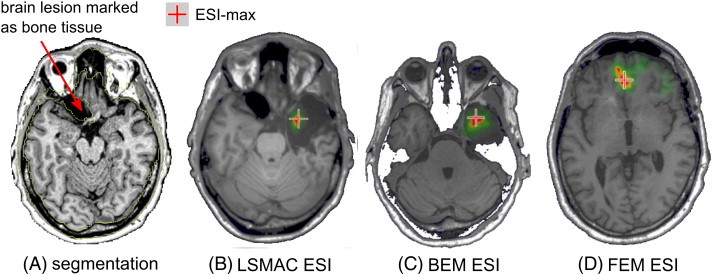
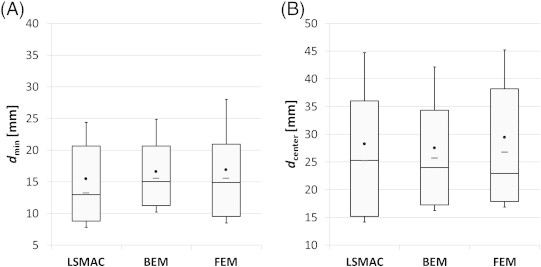
Electrical source imaging (ESI) aims at reconstructing the electrical brain activity from scalp EEG. When applied to interictal epileptiform discharges (IEDs), this technique is of great use for identifying the irritative zone in focal epilepsies. Inaccuracies in the modeling of electro-magnetic field propagation in the head (forward model) may strongly influence ESI and lead to mislocalization of IED generators. However, a systematic study on the influence of the selected head model on the localization precision of IED in a large number of patients with known focus localization has not yet been performed. We here present such a performance evaluation of different head models in a dataset of 38 epileptic patients who have undergone high-density scalp EEG, intracranial EEG and, for the majority, subsequent surgery. We compared ESI accuracy resulting from three head models: a Locally Spherical Model with Anatomical Constraints (LSMAC), a Boundary Element Model (BEM) and a Finite Element Model (FEM). All of them were computed from the individual MRI of the patient and ESI was performed on averaged IED. We found that all head models provided very similar source locations. In patients having a positive post-operative outcome, at least 74% of the source maxima were within the resection. The median distance from the source maximum to the nearest intracranial electrode showing IED was 13.2, 15.6 and 15.6 mm for LSMAC, BEM and FEM, respectively. The study demonstrates that in clinical applications, the use of highly sophisticated and difficult to implement head models is not a crucial factor for an accurate ESI.

Keywords: BEM; Electrical source imaging; Epilepsy; FEM; Head model; High-density EEG.


Figures

Fig. 1
Fig. 1
Distance from ESI-max to irritative zone (IZ). White dots represent intracranial electrodes showing interictal spikes, thus they define IZ. The white dot delimited by a black line represents the electrode showing interictal spikes with the maximum amplitude, it defines max-IZ. The distance from ESI-max (cross) to max-IZ is denoted by dcenter and the distance from ESI-max to the nearest electrode belonging to IZ is denoted by dmin. IZ: irritative zone, ESI-max: maximum activation of electrical source imaging.
Fig. 2
Fig. 2
Percentage rate of superimposed ESI-max with respect to the head model.
Fig. 3
Fig. 3
Distance from ESI-max to IZ. The black dots represent the mean distance, and the whiskers the standard deviation with respect to the mean. The horizontal line within the box is the median value, the top line of the box is the 3rd quartile while the bottom line is the 1st quartile. In panel A the minimum distance from ESI-max to IZ (dmin) is represented. In panel B distance from ESI-max to the centroid of IZ (dcenter) is represented.
Fig. 4
Fig. 4
Example of ESI when the segmentation was inaccurate. The patient was operated in the right temporal lobe and was seizure-free after the resection. In panel A, the pre-resection MRI shows a large lesion in the left frontal region containing CSF. The segmentation algorithm marked this part as bone (outlined by yellow lines). Thus these voxels are labeled as skull tissue in the FEM and the resulting ESI (D) shows a maximum in the mesial frontal region. In contrast, LSMAC and BEM ESI (B and C) show accurate localization of the ESI-max in the right mesial temporal lobe.
Fig. 5
Fig. 5
Distance from ESI-max to IZ without patients with inaccurate segmentations (32 patients remaining). The black dots represent the mean distance, and the whiskers the standard deviation with respect to the mean. The horizontal line within the box is the median value, the top line of the box is the 3rd quartile while the bottom line is the 1st quartile. Median distances without removing inaccurate segmentations (see Section 3.3) are recalled by the gray dashes. Minimum distance from ESI-max to IZ (dmin) is displayed in panel A, distance from ESI-max to the center of IZ is displayed in panel B (dcenter). All values but dcenter of LSMAC have improved compared to those including inaccurate segmentation (Fig. 3). This behavior is more pronounced for the FEM.

Similar articles

Cited by

References

    1. Acar Z.A., Palmer J., Worrell G., Makeig S. Electrocortical source imaging of intracranial EEG data in epilepsy. Conf. Proc. IEEE Eng. Med. Biol. Soc. 2011;2011:3909–3912. - PMC - PubMed
    1. Akalin Acar Z., Makeig S. Effects of forward model errors on EEG source localization. Brain Topogr. 2013;26(3):378–396. - PMC - PubMed
    1. Alarcon G., Guy C.N., Binnie C.D., Walker S.R., Elwes R.D., Polkey C.E. Intracerebral propagation of interictal activity in partial epilepsy: implications for source localisation. J. Neurol. Neurosurg. Psychiatry. 1994;57(4):435–449. - PMC - PubMed
    1. Avanzini P., Fabbri-Destro M., Campi C., Pascarella A., Barchiesi G., Cattaneo L., Rizzolatti G. Spatiotemporal dynamics in understanding hand–object interactions. Proc. Natl. Acad. Sci. U. S. A. 2013;110(40):15878–15885. - PMC - PubMed
    1. Becker R., Pefkou M., Michel C.M., Hervais-Adelman A.G. Left temporal alpha-band activity reflects single word intelligibility. Front. Syst. Neurosci. 2013;7:121. - PMC - PubMed

Publication types