

Transient muscarinic and glutamatergic stimulation of neural stem cells triggers acute and persistent changes in differentiation
- PMID: 25003306
- PMCID: PMC4152385
- DOI: 10.1016/j.nbd.2014.06.020
Transient muscarinic and glutamatergic stimulation of neural stem cells triggers acute and persistent changes in differentiation
Abstract
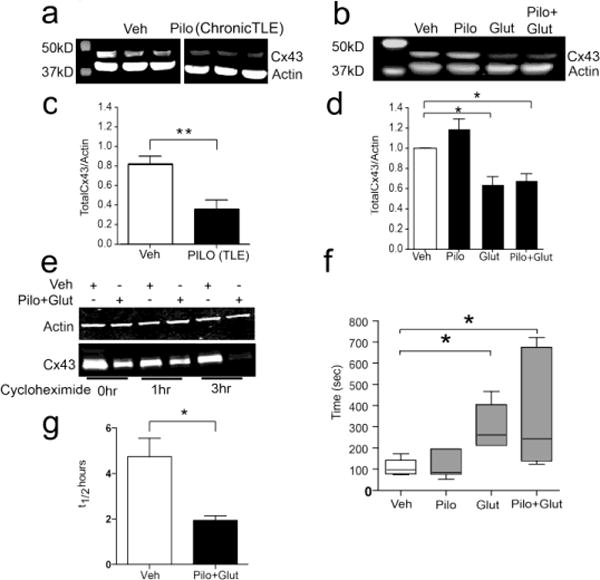
While aberrant cell proliferation and differentiation may contribute to epileptogenesis, the mechanisms linking an initial epileptic insult to subsequent changes in cell fate remain elusive. Using both mouse and human iPSC-derived neural progenitor/stem cells (NPSCs), we found that a combined transient muscarinic and mGluR1 stimulation inhibited overall neurogenesis but enhanced NPSC differentiation into immature GABAergic cells. If treated NPSCs were further passaged, they retained a nearly identical phenotype upon differentiation. A similar profusion of immature GABAergic cells was seen in rats with pilocarpine-induced chronic epilepsy. Furthermore, live cell imaging revealed abnormal de-synchrony of Ca(++) transients and altered gap junction intercellular communication following combined muscarinic/glutamatergic stimulation, which was associated with either acute site-specific dephosphorylation of connexin 43 or a long-term enhancement of its degradation. Therefore, epileptogenic stimuli can trigger acute and persistent changes in cell fate by altering distinct mechanisms that function to maintain appropriate intercellular communication between coupled NPSCs.
Keywords: Connexin; Epileptogenesis; Glutamate receptor; Neural stem cell; Pilocarpine.
Copyright © 2014 Elsevier Inc. All rights reserved.
Figures


Similar articles
-
Degeneration and regeneration of GABAergic interneurons in the dentate gyrus of adult mice in experimental models of epilepsy.CNS Neurosci Ther. 2015 Jan;21(1):52-60. doi: 10.1111/cns.12330. Epub 2014 Oct 1. CNS Neurosci Ther. 2015. PMID: 25272022 Free PMC article.
-
Effects of muscarinic acetylcholine receptor stimulation on the differentiation of mouse induced pluripotent stem cells into neural progenitor cells.Clin Exp Pharmacol Physiol. 2018 Nov;45(11):1198-1205. doi: 10.1111/1440-1681.12993. Epub 2018 Jul 26. Clin Exp Pharmacol Physiol. 2018. PMID: 29920752
-
Blockade of pilocarpine-induced cerebellar phosphoinositide hydrolysis with metabotropic glutamate antagonists: evidence for an indirect control of granule cell glutamate release by muscarinic agonists.Neurosci Lett. 2000 May 5;285(1):71-5. doi: 10.1016/s0304-3940(00)01023-5. Neurosci Lett. 2000. PMID: 10788710
-
Prenatal betamethasone does not affect glutamatergic or GABAergic neurogenesis in preterm newborns.Neuroscience. 2014 Jun 13;270:148-57. doi: 10.1016/j.neuroscience.2014.04.009. Epub 2014 Apr 13. Neuroscience. 2014. PMID: 24735821 Free PMC article.
-
Neural transcription factors: from embryos to neural stem cells.Mol Cells. 2014 Oct 31;37(10):705-12. doi: 10.14348/molcells.2014.0227. Epub 2014 Sep 18. Mol Cells. 2014. PMID: 25234468 Free PMC article. Review.
Cited by
-
Role of aquaporins in brain water transport and edema.Front Neurosci. 2025 Jan 29;19:1518967. doi: 10.3389/fnins.2025.1518967. eCollection 2025. Front Neurosci. 2025. PMID: 39944892 Free PMC article. Review.
-
Neural Differentiation of Human Pluripotent Stem Cells for Nontherapeutic Applications: Toxicology, Pharmacology, and In Vitro Disease Modeling.Stem Cells Int. 2015;2015:105172. doi: 10.1155/2015/105172. Epub 2015 May 25. Stem Cells Int. 2015. PMID: 26089911 Free PMC article. Review.
-
Statins impact primary embryonic mouse neural stem cell survival, cell death, and fate through distinct mechanisms.PLoS One. 2018 May 8;13(5):e0196387. doi: 10.1371/journal.pone.0196387. eCollection 2018. PLoS One. 2018. PMID: 29738536 Free PMC article.
-
The central role of aquaporins in the pathophysiology of ischemic stroke.Front Cell Neurosci. 2015 Apr 8;9:108. doi: 10.3389/fncel.2015.00108. eCollection 2015. Front Cell Neurosci. 2015. PMID: 25904843 Free PMC article. Review.
-
Pharmacogenomic identification of small molecules for lineage specific manipulation of subventricular zone germinal activity.PLoS Biol. 2017 Mar 28;15(3):e2000698. doi: 10.1371/journal.pbio.2000698. eCollection 2017 Mar. PLoS Biol. 2017. PMID: 28350803 Free PMC article.
References
-
- Bruzzone R, Dermietzel R. Structure and function of gap junctions in the developing brain. Cell Tissue Res. 2006;326:239–48. - PubMed
-
- Carey MB, Matsumoto SG. Spontaneous calcium transients are required for neuronal differentiation of murine neural crest. Dev Biol. 1999;215:298–313. - PubMed
-
- Cheng A, et al. Gap junctional communication is required to maintain mouse cortical neural progenitor cells in a proliferative state. Dev Biol. 2004;272:203–16. - PubMed
Publication types
MeSH terms
Substances
Grants and funding
LinkOut - more resources
Full Text Sources
Other Literature Sources
Miscellaneous
